A bitcoin bull pennant shows big price moves ahead. The cryptocurrency market volatility pushes for $140,000 soon. Expert Ali uses crypto investment strategies to spot this pattern. Bitcoin sits at $94,448 as traders watch closely.
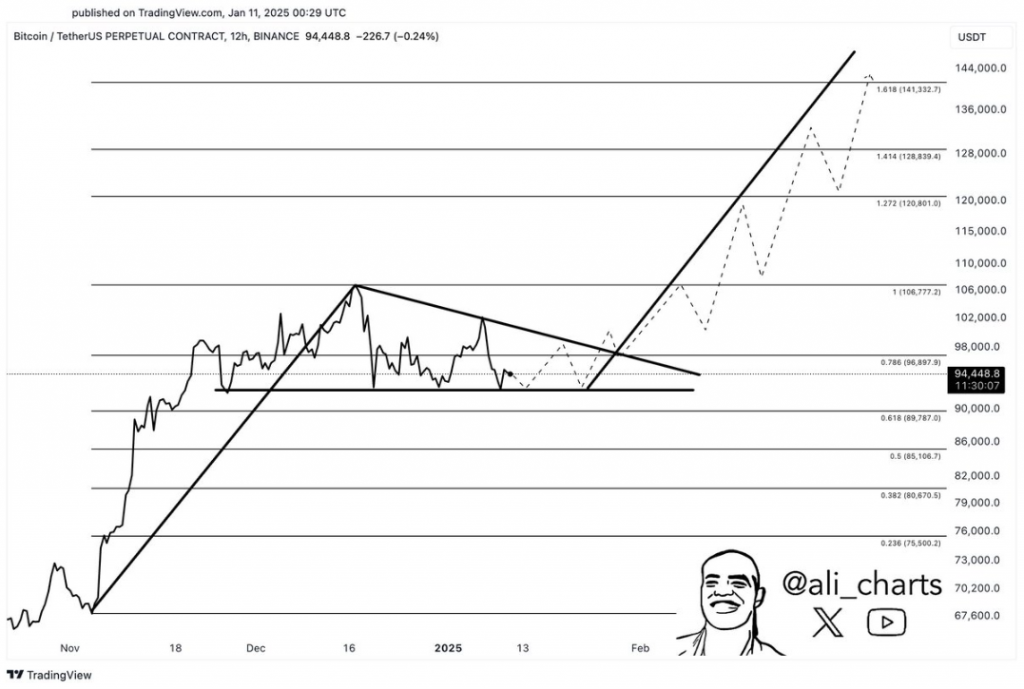
What if instead of the head-and-shoulders top everyone is talking about, #Bitcoin $BTC is actually forming a bull pennant, targeting $140,000 next? pic.twitter.com/50iE0xJGXp
— Ali (@ali_charts) January 11, 2025
Also Read: Binance’s BNB Predicted To Hit New High After Trump’s Oath
Understanding Bitcoin Bull Pennant and Its Potential for $140K Target in Crypto Market Volatility


Bull Pennant Formation Points to Major Upside


“Bitcoin is likely to be trading within a triangle formation that is usually a bullish pennant,” states Ali. The bitcoin bull pennant forms between $86,897 and $106,777. High cryptocurrency market volatility suggests a jump soon. Charts show $144,332 as the top target.
The price shot up before this pattern.
“If this pattern continues to be the same, it would most likely shoot up to $140,000 as mapped out in the bull pennant,” Ali explains.
Breaking past $106,777 boosts crypto investment strategies. Dropping under $86,897 risks $78,757.
Also Read: How Many Grams are in an Ounce of Gold?
Short-Term Analysis Reveals Falling Wedge Pattern


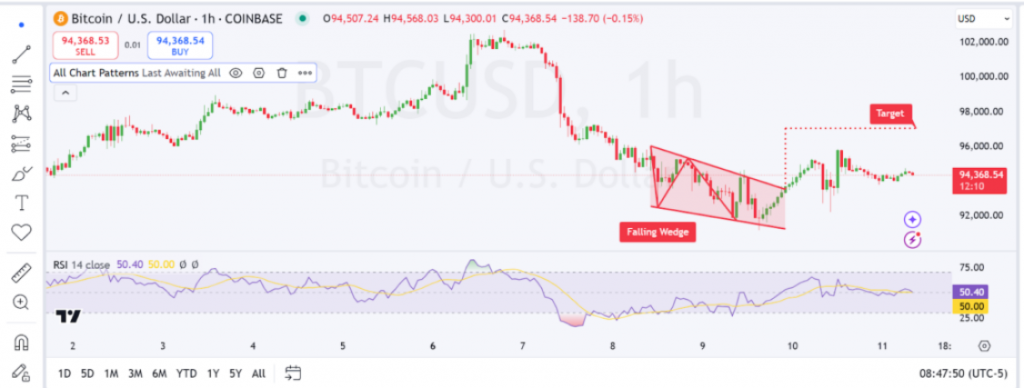
The Bitcoin breakout target shows on smaller timeframes, too. A new pattern points to $96,000 next.
“Recent price actions indicate that Bitcoin has already breached this wedge pattern format and may be headed towards $96,000 in the near future,” notes Ali. The bitcoin bull pennant gains strength.
The price sits at $94,368 after moving up. “The breakout from the wedge might tilt the scales in the direction of the bulls,” say experts. Cryptocurrency market volatility keeps rising.
Also Read: How to go Frame by Frame on Youtube?
Technical Levels and Price Targets
The charts show Bitcoin could reach $140,000. This is what the breakout target tells us. Ali has mapped out the steps to get there. First, there’s resistance at $106,777. Then another stop at $120,801. What could be the final target, you ask? According to Ali, it’s “$144,332 using the 1.618 Fibonacci extension.”
At this point in time, the bitcoin bull pennant is getting tighter and tighter. When this happens, a big price move usually follows. Traders are watching two key levels right now, and they have very good reasons to. The resistance level sits at $96,000. And the support level is down at $86,897. These levels are crucial for their trading plans.


