


Ethereum breakout signals have begun to emerge right now, with recent market data actually indicating a potential bottom formation. The second-largest cryptocurrency by market cap is currently showing promising signs of recovery amid the ongoing market volatility that has plagued investors lately. Whale accumulation patterns, and also decreasing volatility metrics, as well as substantial net inflows, provide key indicators that Ethereum’s price prediction models may soon turn bullish, at least according to current analysis.
Also Read: Dogecoin: Elon Musk’s Grok Predicts When DOGE Will Hit $0.90
Ethereum’s Road to Recovery: Price Predictions, Market Volatility, and Key Signals

Whale Accumulation Signals Bottom Formation
Recent data from decentralized exchanges shows significant whale activity that may be signaling an Ethereum recovery. Over the past 24 hours, whale buying volume actually reached $9.41 million compared to selling volume of $6.17 million, creating a positive disparity that kind of suggests strong confidence among major investors right now.
Small DEX Traders (SDTs) were also found accumulating ETH, with buying volume of $3.21 million against selling volume of $2.34 million. These trends collectively point to a market stabilization that typically precedes an upward price movement, and this is something we’re definitely seeing at the time of writing.
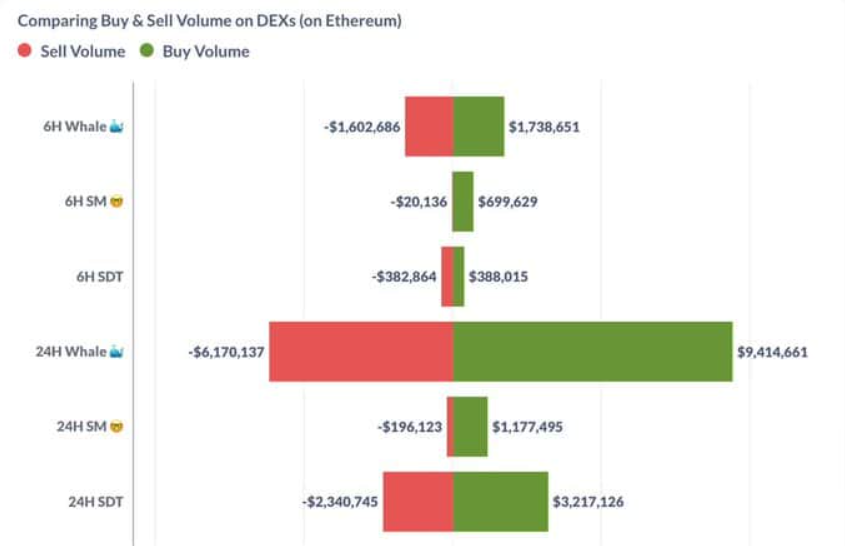
Substantial buying pressure has followed weeks of cryptocurrency investment uncertainty and widespread fear. While Smart Money traders showed more caution with buying volume of $1.77 million versus selling at $1.96 million, the overall trend generally supports the hypothesis that ETH may have possibly reached its market bottom.
Ethereum Breakout Imminent? Historical Price Patterns Suggest Significant Upside Potential
Ethereum price prediction models often rely on historical patterns, and the current market structure bears striking similarities to previous bottom formations from what we can see. The rally from late 2023 to early 2024 saw ETH surge by about 157.49%, and current price action appears to be forming a comparable pattern near key moving averages, which is quite interesting.
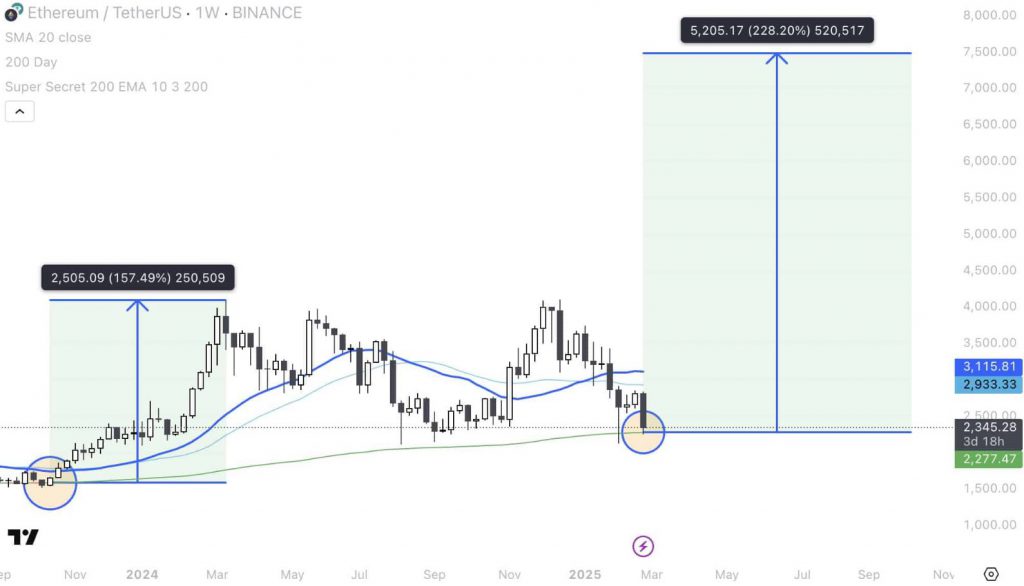
Projections based on these patterns suggest a potential upside move of around 228.2%, aligning with past market cycles and such. Traders are closely watching this technical structure as market volatility stabilizes, often serving as a precursor to significant price movements.
Also Read: US Car Dealership Officially Accepts Pi Coin as New Payment Option
Net Inflows Paint Bullish Picture Despite Short-Term Outflows
Institutional and large-holder activity provides additional confirmation of accumulation trends, at least in some ways. ETH’s total netflow stood at 55.34K ETH, with the 7-day period showing strong net inflows of +88.89K ETH. The 30-day accumulation also reached +47.35K ETH, suggesting longer-term accumulation despite short-term fluctuations and occasional dips.
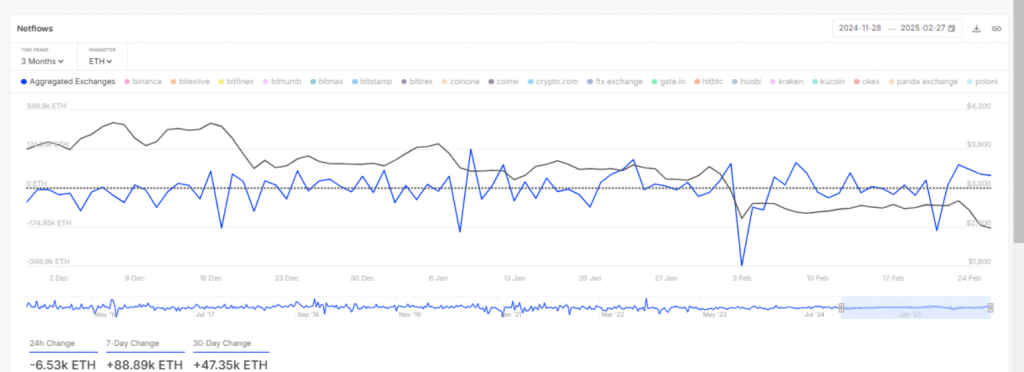
These metrics reveal that while 24-hour flows showed an outflow of -6.53K ETH, possibly due to profit-taking and such, the medium and long-term trends remain somewhat positive. Such patterns typically precede price recoveries in the cryptocurrency market, as we’ve seen many times before.
Volatility Stabilization Reinforces Bottom Theory
Ethereum’s volatility metrics demonstrate a marked decrease, further supporting the bottom formation theory that many analysts are discussing. After peaking at 81.61% on February 25th, volatility has significantly dropped to around 15.47% in recent hours, which is quite a substantial change.
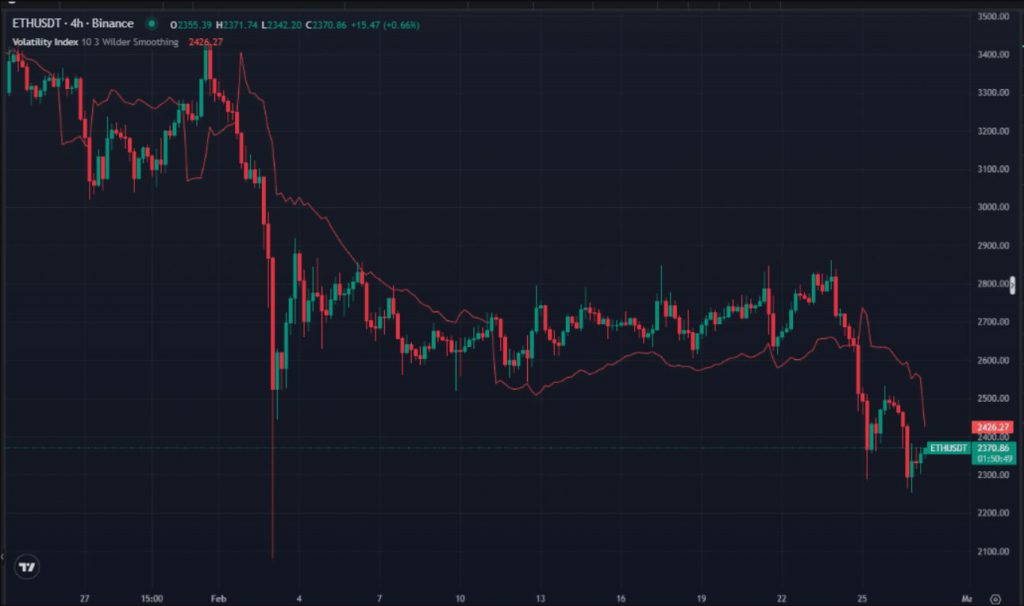
This reduction in market volatility often signals the end of panic selling and capitulation phases that characterize market bottoms, and this is certainly something to keep an eye on. Ethereum exhibited similar volatility patterns in October 2023 before beginning its upward trajectory, establishing a clear historical precedent.
Several bullish catalysts may further support Ethereum’s recovery, including leadership changes at the Ethereum Foundation, gas limit modifications, and potential staking integration for spot Ethereum ETFs. These developments could sustain upward momentum if volatility continues to decrease and market sentiment improves.
Also Read: Ripple: AI Predicts How Low Can XRP Fall In The Current Market Scenario
The combination of whale accumulation, historical price patterns, positive netflows, and volatility stabilization provides compelling evidence that ETH may be positioned for an Ethereum breakout. While short-term market volatility remains a concern for many investors, the convergence of these indicators suggests that ETH’s recovery phase may already be underway, though of course nothing is ever guaranteed in the crypto markets.