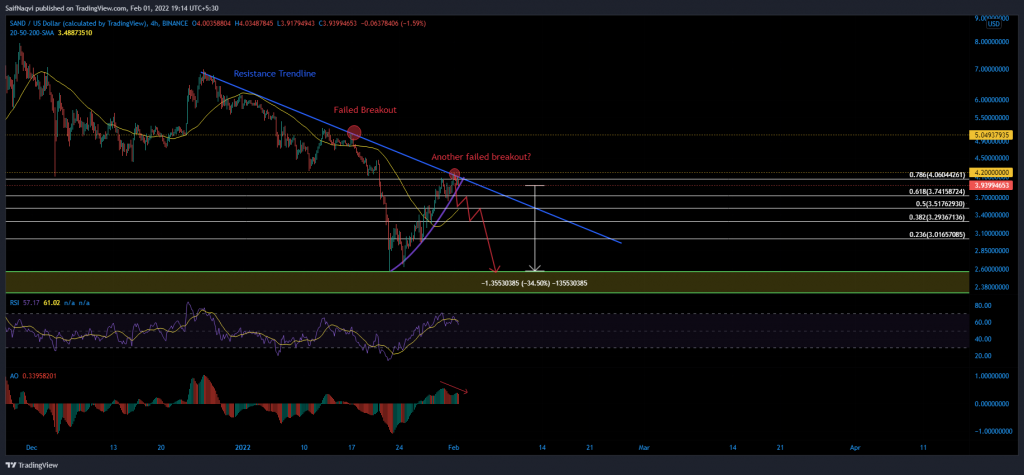
The Sandbox eyed a red week of trade after failing to progress above a key resistance trendline. Its price was vulnerable to a 35% sell-off if buyers are unable to trigger a rebound around $3.5. At the time of writing, SAND traded at $3.94, down by 1.2% over the last 24 hours.
The Sandbox 4-hour Time Frame


The Sandbox could be in for a rude awakening this week as Bitcoin spearheads an altcoin recovery. Its price was unable to progress above December’s swing low of $4.1 after recording a 64% spike between 22-31 January. Moreover, a failed breakout above the resistance trendline now aligned the market perfectly for bears. The trendline has halted SAND’s recovery attempt twice since late-December.
Sellers can reign in the pain by forcing a close below $3.66-support. The resulting breakdown would see SAND lose out on its chain of lower highs, giving way to a fresh downtrend. If an early pushback is not offered at the 50-SMA (yellow) and 50% Fibonacci level, losses could extend all the way to the daily demand zone between $2.58-$2.31. However, this region was bolstered by the 200-SMA (green) and made for a cheap buy opportunity.
On the other hand, a close above the upper trendline would invalidate the outlook A 16% extension to $4.7 would be possible if SAND flips $4.1 on good buy volumes.
Indicators
The RSI had completed a full run-up from the oversold to overbought regions between 22 December – 31 January. A rejection at 75 now could transpire into a downswing back to 35 once again. The Awesome Oscillator also backed a weak outlook by flashing a bearish twin peak setup.
Conclusion
SAND investors should brace for some heavy losses if the price does not close above $4.20. A correctional phase could drag SAND’s value towards $2.5 in an extremely bearish scenario.


