Less pain and more gain have been synonymous for Shiba Inu investors who made over 1,200% profits during its late-2021 bull run. Come 2022, and the narrative is vividly different. Bitcoin’s troubles have amplified Shiba Inu losses and gauging investor sentiment, the market is likely to remain constrained this month until a major resistance is cleared. With bears carrying the advantage heading into May, here are the important levels Shiba Inu investors must watch out for during the month.

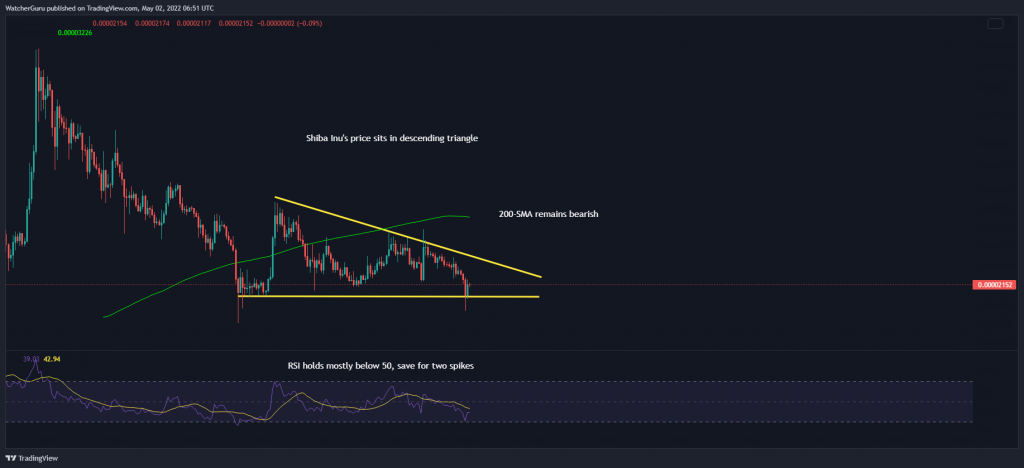
Shiba Inu carries a bearish undertone despite rallies made after the momentous Robinhood listing. Lower highs have created a descending triangle on the daily chart – showing that bulls failed to maintain upwards pressure. The price was yet to cross above the daily 200-SMA (green) while the RSI has mostly traded below 50 this year- developments which show that sellers have dominated over buyers.
Large holders sell but total addresses recover


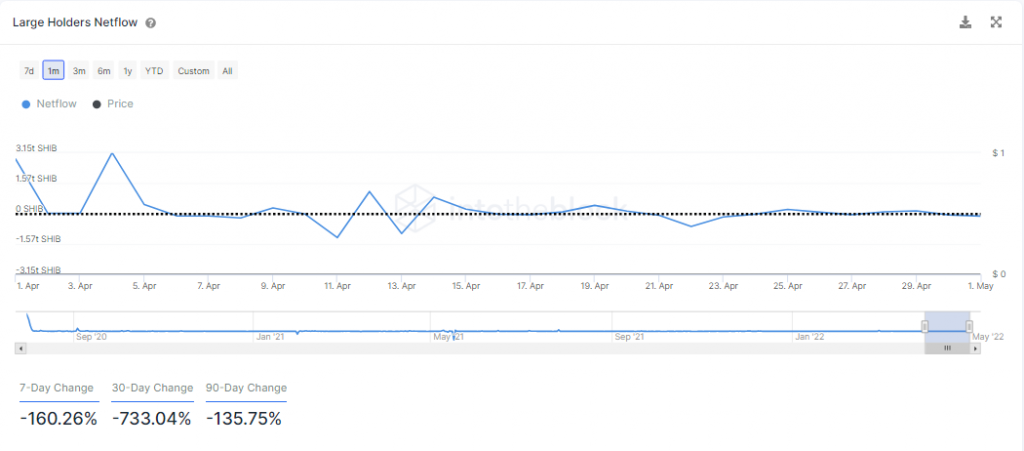
Large holders NetFlow also dropped significantly during April, showing that addresses holding above 0.1% of SHIB’s circulating supply have mostly been selling rather than accumulating. The trend remained similar last week as well, with the metric down by 160% for the week.


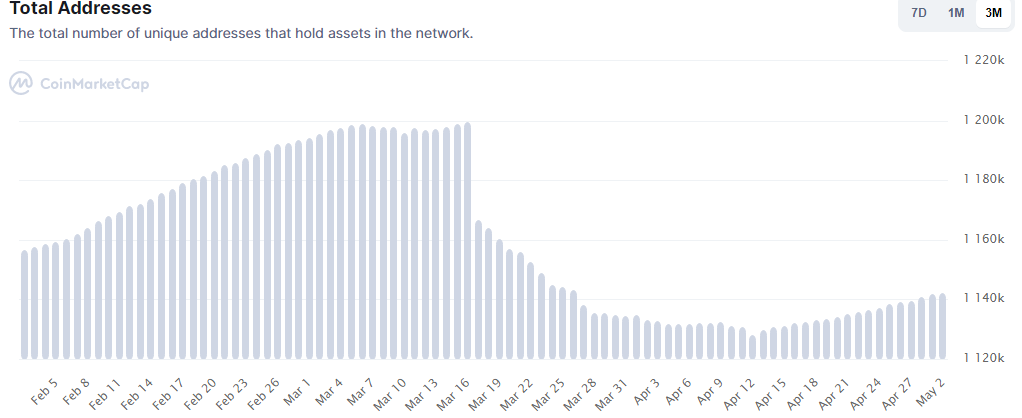
There is a shining beacon of light, however. The total number of addresses has started to recover since mid-April, suggesting that discounted prices have attracted investors back to the project. While the same isn’t enough to warrant a rally, it could safeguard SHIB from an overtly bearish outlook.
Shiba Inu Daily Chart


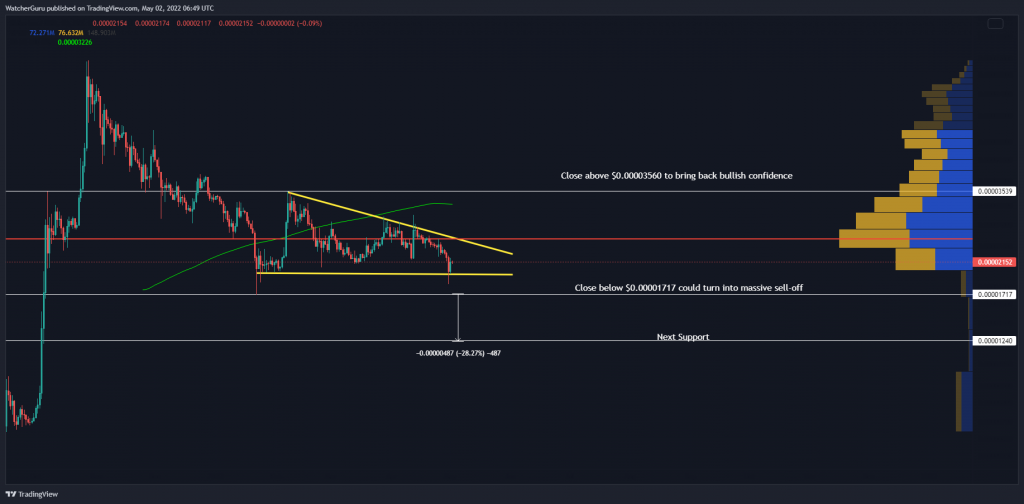
With chances of Shiba Inu heading lower this month rather than a rally, support lines take front and center. The most crucial area SHIB would need to hold on to this month lies at a demand zone between $0.0000200-and $0.00001700. The zone was also ideal for accumulation and it shouldn’t be a surprise if Ethereum whales start to make some notable purchases this month.
A daily close below this demand zone could spell trouble. The next logical defense lay at $0.00001200, meaning that SHIB’s price would be exposed to a 30% sell-off should the market suffer a breakdown.
Back to a bull scenario would require a back-breaking effort but overtaking $0.00003400 should bring back a ton of confidence amongst investors. The market would be more welcoming of buy orders, with the price past the 200-SMA (green), the Visible Range’s point of control at $ $0.00002500, and a major resistance mark of $0.00003560.


