


Algorand is one of the Altcoins which registered a new all-time high during the September rally. Alongside the likes of Solana, Cardano, ALGO peaked at $2.55 but since then, the asset has been range-bound. Between 19th September to 10th November, Algorand spent the majority of its time between $2.04 and $1.70.
However, it recently closed a strong candle above the immediate resistance of $2.04 but it hasn’t taken bullish advantage yet in the short-term. At the time of writing, ALGO had a market cap of $13.7 billion, with a $633 million 24-hour trading volume.
ALGORAND: 4-hour Time Frame
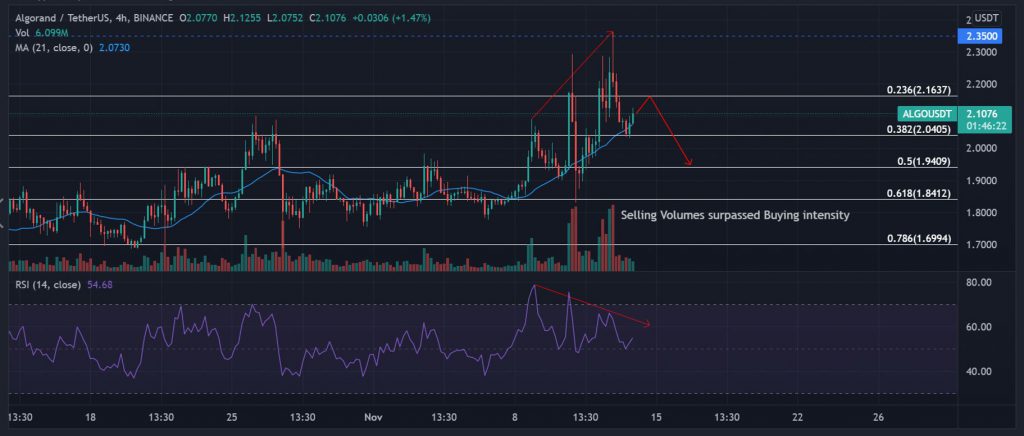
Algorand’s 4-hour chart is a mix-bag of signals at the moment. One of the bullish signs is illustrated by the 21-Moving Average, as the price continues to hover above the indicator. However, the Relative Strength Index or RSI and the price suggested a massive bearish divergence(red arrows). Dropping buying pressure alongside rising prices indicates weak rallies. One more bearish sign observed was strong selling volumes during the recent correction.
However, as mentioned earlier, ALGO remained above $2.04 at press time, recovering quickly from the support at $1.94.
Market Indicators
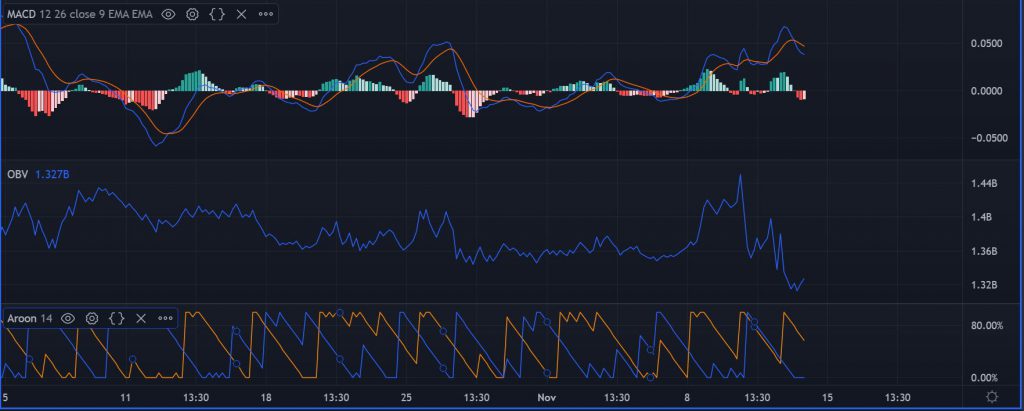
A similar contradiction is observed among market indicators. MACD registered a bearish trend at press time, as the orange line crossed over the blue line. Yet, On-Balance-Volume indicated a potential buy signal, as it reached a temporary bottom. Aroon indicator suggested that same, as the Aroon Up(yellow line) was above the Aroon Down(blue) line.
How to trade ALGO right now
In the short term, ALGO should muster enough bullish momentum to re-test the $2.16-$2.20 resistance range but the long-term trend is somewhat bearish. Support at $1.94 could be tested going into the 2nd half of November. Bullish trend confirmation requires a daily candle close above $2.20 in the next couple of weeks.