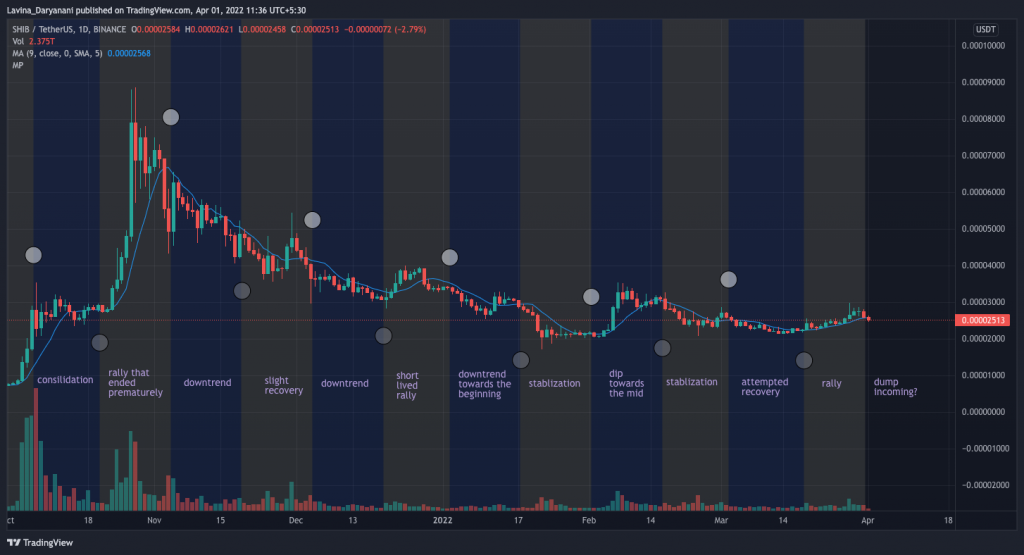
Shiba Inu welcomed the first day of the new financial year by plummeting on its charts. Over the past 24-hours, this token has shed over 10% of its value. In fact, at the time of press, it was exchanging hands at merely $0.00002509.
The mega financial astrology x Shiba Inu crossover
Using the science of astronomy alongside mathematical psychology, financial astronomy aids in ascertaining the market sentiment. Lunar cycles are, perhaps, relied upon the most to sort of predict price movements.
Usually, assets tend to behave in patterns depending on the state of the moon. In some markets, full moons mark the beginnings of short-term upswings, while in others new moon periods are considered to be the lucky charm.
As far as the crypto market is concerned, the fortnight following any new moon night has mostly been bearish and vice versa.
Per TradingView’s Moon phases indicator, a dark circle represents a full moon while a bright white circle indicates a new moon. Interestingly, the space between the said periods is splashed with colors accordingly – yellow [growing] and navy blue [waning].


Since November last year, Shiba Inu’s price has mostly maintained the sanctity of the trend. Barring a couple of minor deviations, the token’s price has either rallied or stabilized in yellow patches, while on the navy blue ones, it has more often than not dipped or attempted to pull off recoveries. The same has been chalked out on the chart above.
We are currently in and around the new moon period, and per tradition, the next fortnight is set to be wobbly for Shiba Inu. However, as noted in the past, the market might witness a pre-mature end to the phase and start climbing up midway, if the sentiment flips to bullish. If not also, the bearish phase wouldn’t be able to sustain for more than a fortnight.
Market participants can make the best use of the next few days to accumulate during the dips and then leisurely wait for Shiba Inu to start its next leg up in the direction of the moon.


