


Bitcoin has continued to maintain its indecisiveness over the past few days. However, on the macro frame, things have started to stabilize. The two month-downtrend was broken on 24 January, after its price dunked to a level as low as $32.9k. Since then, the coin has been able to kickstart an uptrend.
So, was $32.9k Bitcoin’s lowest point? Is it macro-bottom already? To a fair extent, yes. The same was analyzed in-depth in a recent article keeping the supply held by short holders in mind.
To cross-confirm the same, we’ll look into the state of other fundamental metrics in this article.
The Bitcoin Long Term HODLer perspective
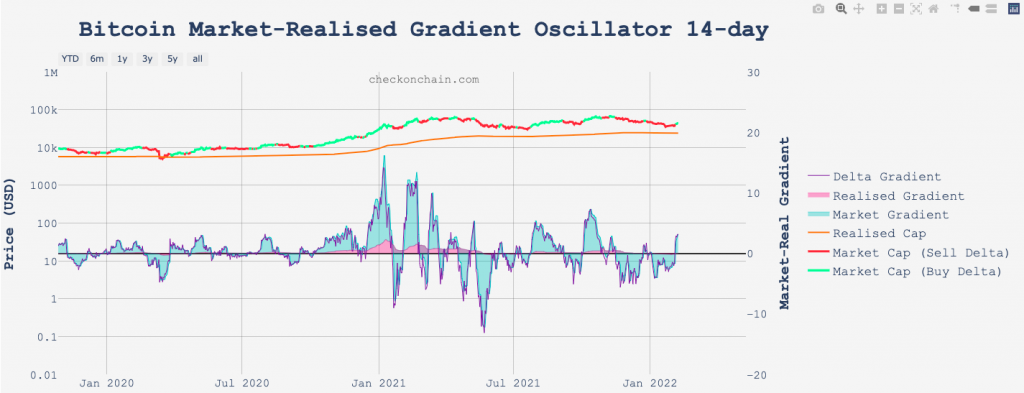
To begin with, let’s peek into the state of the market realized gradient oscillator. This metric, as such, gauges the degree of momentum in market pricing relative to the capital inflows, recorded in the realized cap.
Back to back higher/lower peaks indicate increasing momentum to the upside/downside, respectively. Also, breaks above/below 0 indicate that a new uptrend/downtrend is in play.
During the initial few months of last year when the market cap peaked, a bearish divergence was formed on the chart – the momentum started declining alongside the higher highs in price. However, the current period reflects a bullish divergence.
With each new price low set, there is reducing momentum to the downside. As can be noted from the chart attached, the 14-day MRG has now convincingly broken above 0. The same render confluence and magnitude to the argument that Bitcoin has at least bottomed out, if not in the macro frame, in the micro-frame at least for sure.
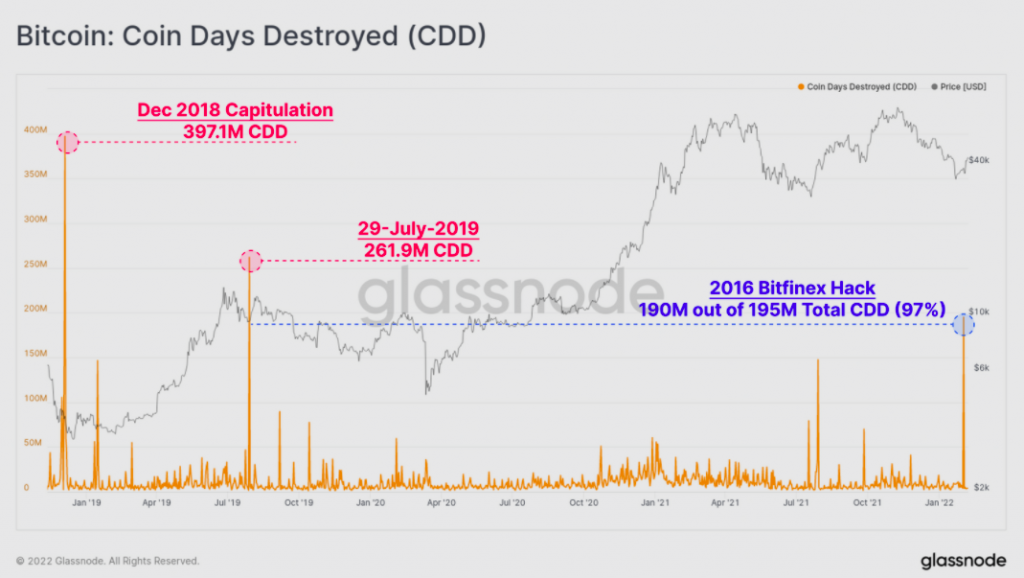
The Coin Days Destroyed pointed out another interesting trend. As can be seen from Glassnode’s chart attached, this metric spiked to a multi-year high with a total of 195M coin-days destroyed recently. 190M (97%) of the same were, nevertheless, associated with wallets from the 2016 Bitfinex hack.
Post the spike, the tip of the curve is back to its lows, which is a good sign yet again. For context, low values on this indicator usually suggest that confidence is returning amongst long-term holders. These participants are beginning to HODL now instead of spending their coins, and such behavior patterns have usually been observed in bullish markets during price corrections and consolidations.
Also, it should be noted that the $30k to $40k price range has acted as a strong support level for Bitcoin for more than a year now. Last year, this range was defended post the flash crash in the May-July period, provided support during the September corrections, and yet again provided Bitcoin a cushion to lean on earlier in January this year.
Thus, keeping in mind the essence of the said price range and the state of the fundamental factors in mind, it doesn’t look like Bitcoin would dip to form a new low at this stage.