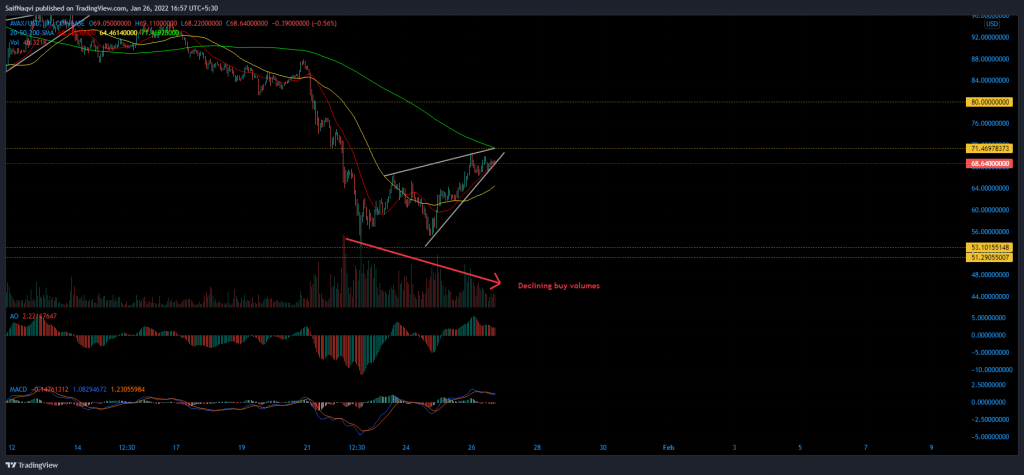
Avalanche’s wedge has approached a pivotal moment on the hourly chart. If the hourly 200-SMA halt its progress, AVAX would be in danger of slipping back to $50 post a breakdown. At the time of writing, AVAX traded at $68.6, up by 6% over the last 24 hours.
AVAX Hourly Time Frame


AVAX’s recovery has been consistent with most mid-caps in the altcoins market. Between 24-26 January, its price rose by 27% amid healthy buy volumes. However, bulls cannot afford to take their foot off the gas as AVAX’s wedge approached an important test at the hourly 200-SMA (green). The long-term moving average line clashed with a possible double-top setup around $71, making a breakout quite tricky to achieve.
READ ALSO: Here’s when to expect Avalanche’s next uptrend phase
Buy volumes have also tapered off over the past few sessions and the same was not an encouraging sign for those expecting an upwards breakout. If AVAX does not register a complete 4-hour candle above $71, sellers would respond with a breakdown of their own. A severe correction would see AVAX decline by 23%-25%, followed by a test of $51-$53 support.
If the unlikely event of a breakout, the upside would be limited to a supply zone between $77-$80. Bulls would need to be supported by a broader market recovery to flip this zone to demand once again.
Indicators
The hourly Awesome Oscillator flashed an early sell signal after creating two lower peaks above the half-line. Meanwhile, the MACD maintained a near-term bearish outlook as the Signal line (orange) traded above the Fast-moving line (blue).
READ ALSO: Avalanche Price Prediction: Is a drop back to $110 expected?
Conclusion
Considering weak readings on the hourly indicators, Avalanche’s wedge was likely to witness a breakdown heading forward. Traders can take up short-positions once AVAX closes below the lower trendline and hourly 20-SMA (red). Take-profits can be set up at $53 while a stop-loss should be maintained at $73, slightly above the hourly 200-SMA


