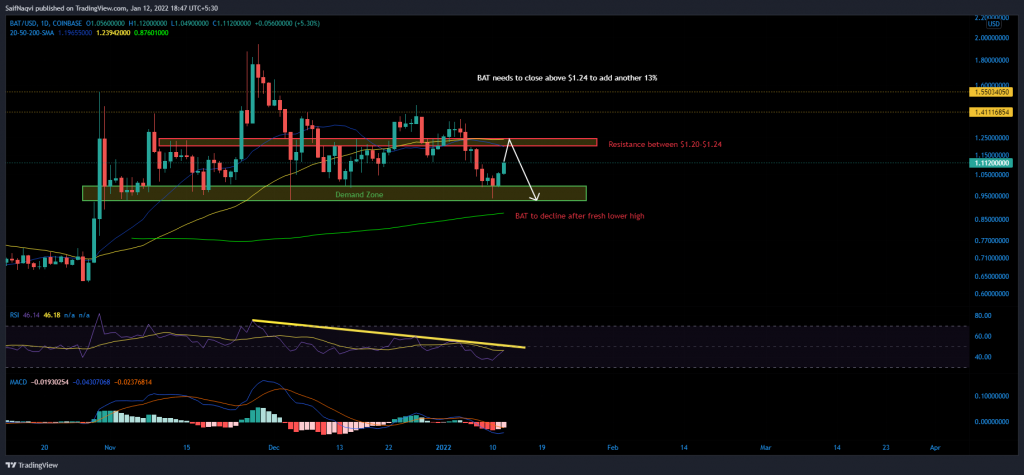
Basic Attention Token took an interesting U-turn after touching record levels in November 2021, but bulls have held strong in the face of danger. Its demand zone of $0.93-$0.98 has negated yet another breakdown attempt, leading to a brief run-up. However, gains would most likely be capped below $1.24 due to a larger downtrend active in the market.
Basic Attention Token Daily Chart


BAT’s demand zone $0.93-$0.98 continues to be a thorn for sellers after surviving yet another attack on 10 January. Fresh longs have helped BAT recover by 13% so far and its value was expected to surge by another 7%-11% heading forward. However, gains would most likely be limited to $1.20-$1.24. This region harbored BAT’s daily 20 (blue) and 50 (yellow) SMA’s, both of which functioned as resistance. Another drawdown to BAT’s demand zone can be expected soon after the next lower high is formed.
Should bulls force be above $1.24, BAT would enjoy a further 13% surge due to the lack of sell liquidity. Meanwhile, bears faced the near-impossible task of breaching BAT’s demand zone. If sellers do push through, expect a massive decline provided the daily 200-SMA (green) does not offer an early pushback.
Indicators
Although BAT’s RSI did point north, the upside would be limited to 50 based on its upper sloping trendline. Expect the RSI to shift to the oversold territory after tagging this trendline.
Similarly, a possible bullish crossover on the MACD could invite buying pressure, but a degree of skepticism would remain until the index recovers above equilibrium.
Conclusion
BAT’s rally could extend to $1.20-$1.24 before sellers take charge. From there, the spotlight would shift back to BAT’s demand zone once again. Long orders can be placed between $0.93-$0.98 but stop-losses should be tight to safeguard against a case of a broader market sell-off


