


Much like the broader crypto market, Binance Coin did not have the best end to 2021. The token’s value dropped as low as 11.5% between 28 December to 1 January 2022 as trading outflows were noted all across the board. In fact, another retracement was expected before the alt attempts to mirror its phenomenal 2021 bull run.
A bearish pattern was spotted on the lesser time frame put BNB at the risk of minor pullback between 3%-7%. At the time of writing, BNB traded at $525, up by a marginal 0.4% over the last 24 hours.
Binance Coin Hourly Time Frame
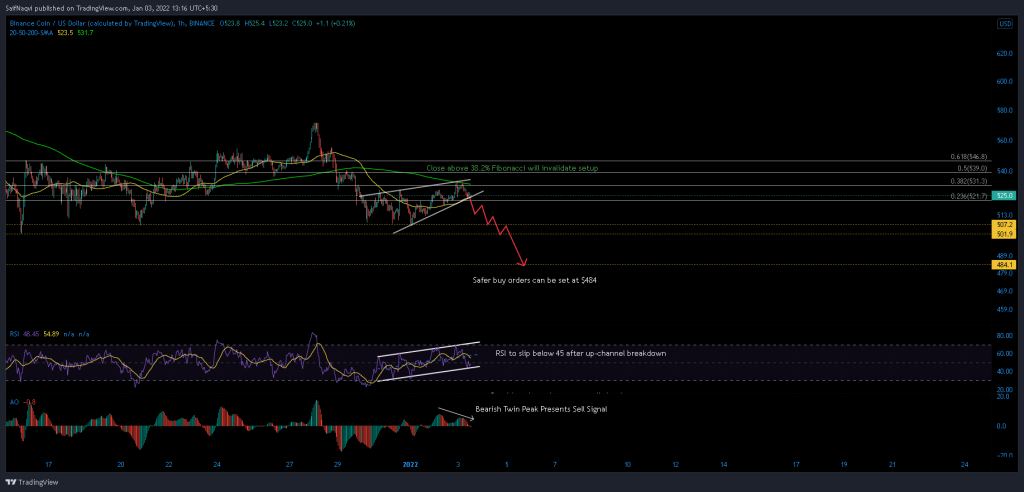
Since the last four days, Binance Coin has formed a series of higher lows and higher highs. Two converging trendlines plotted along these highs and lows outlined a rising wedge pattern on the hourly chart. The bearish setup carries a high risk of a breakdown, which is normally observed after the price slips below an important support line.
The Fibonacci tool, which was plotted using BNB’s decline from $571 to $506, identified that the price was trading at the 23.6% Fibonacci level. This region also coincided with the hourly 50-SMA (yellow). Ideally, a close below this confluence would trigger a decline anywhere between 3%-7%. Support lines at $507, $501 could offer an early rebound while $484 would be in focus in case of a deeper sell-off.
To force an upwards breakout, BNB would have to close above its hourly 200-SMA (green) which coincided with the 38.2% Fibonacci level. However, weakening buy volumes presented little chances of a bullish outcome.
Indicators
The hourly RSI currently traded at the lower end of its up-channel. With an up-channel in play, the RSI was also exposed to a potential breakdown and even though 50 is considered a neutral zone, sellers can immediately jump on board if the index slips below 45.
A bearish twin peak on the Awesome Oscillator was also not encouraging. The setup is often regarded as a sell signal as it highlights that bulls are losing market momentum.
Conclusion
BNB’s price was exposed to a breakdown after trading at crucial support within a rising wedge pattern. Investors can short-sell BNB once it closes below $521 and set take-profits between $501-$507. Meanwhile, those hunting for a discounted level can set up buy orders at 4 December’s low of $484.