


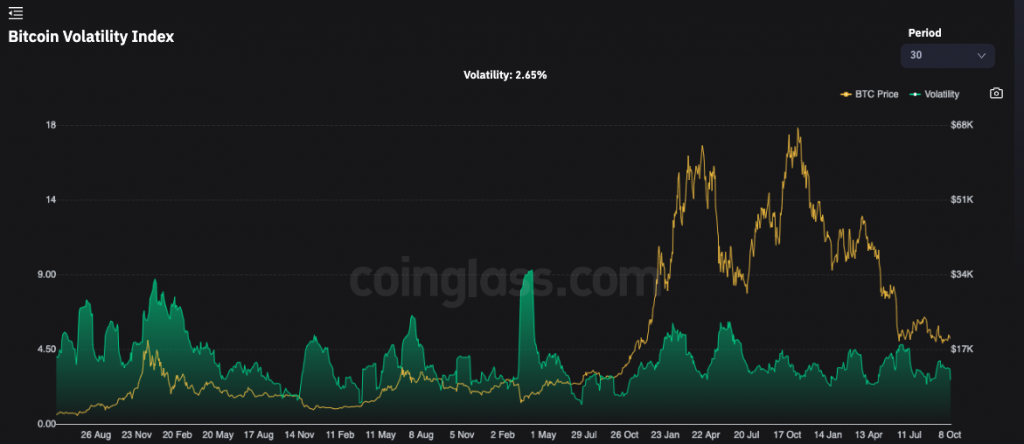
The volatility in the Bitcoin market has been on the fall of late. The current reading of 2.66% depicts that Bitcoin volatility is roughly half of what it was in the latter half of June. As a result, the price of the largest crypto asset remains to be stagnated at around $19k.
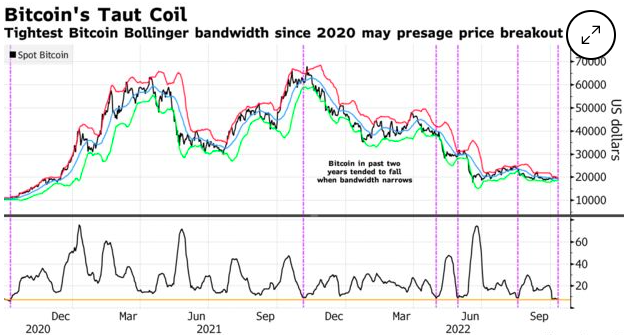
In fact, the state of the Bollinger Bands echoed the same narrative. A recent analysis by Bloomberg brought to light that the width between the said bands has shrunk to its narrowest since 2020.
This technical analysis indicator gauges volatility by measuring the gap between the upper and lower bands. Per the thumb rule, when the bands are far apart, volatility is high in the market. Contrastingly, when they are close together, volatility is low. Periods of low volatility are generally followed by high volatility and vice versa.
The width between the bands has been this narrow around five other times in the past two years. In four instances, Bitcoin ended up shedding almost 16% over 20 days.
So, should market participants expect their losses to mount this time as well?
Gauging the current Bitcoin market sentiment
Bitcoin has been stuck in the “no one buy” zone. Reasonably, the longer the market falls, the less short-term buying takes place. And that’s typically how the market has been characterized lately.
Cici Lu—Chief Executive Officer of Venn Link Partners—recently told Bloomberg,
“I still don’t think we will have a bullish run anytime soon.”
This week, however, remains to be the key. With CPI numbers set to be released, we could see volatility rise in the markets, triggering a potential break out from the current range. If that indeed transpires, then the direction will depend on the released data’s number print.
According to Darius Sit—Co-Founder of crypto investment fund QCP Capital,
“We expect Bitcoin’s price to be very macro-driven in the near term.”