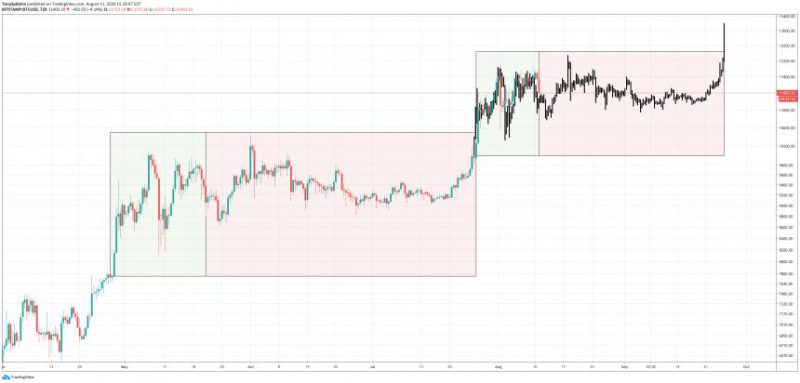
September has always been a bearish month for crypto markets. This year it is no different. Bitcoin saw a dip from $52,700 to $44,000 in a market-wide flash crash. Since then, BTC has been struggling to get back above $50,000. Can Bitcoin still make it to $360,000 by the end of the year, as many analysts predicted at the beginning of this bull market?
Fractals: What Are They?
In technical analysis, a fractal is a repeating geometric pattern that can be observed on frames. The time frames on the trading chart include 1M all through 1 year. Identifying these structures can help predict the next occurrence of the event with acute precision. For example, fractals occur in trees, shells, and even rock formations.
Bitcoin is Fractal?


Yes. The long-term bitcoin chart shows a fractal that predicts a $350,000 BTC by the end of 2021. History has repeated itself for Bitcoin twice now. Using the bull run of 2013, some analysts could predict how long the 2017 bull run would last. In addition to that, they could also estimate how long the bear winter would persist. Once again, the chart gurus have consulted this indicator. Bit Harington, a pseudonymous chart analyst, spotted the pattern.
He notes that history shows that BTC surges after a halving event (slashing of miner rewards by 50%). According to the Stock/Flow chart, BTC is at a crucial level. He notes that “there is a Bitcoin double top after every halving.” Harrington suggests that Bitcoin will break above the current $60,000 resistance and head above $250,000 to $350,000.
In line with this prediction, Tyler Swope has also predicted that BTC will touch $100,000 by the end of the year, albeit from a different perspective. According to Tyler Swope, the coming rally could be the last bullish upward push of the season before the bear winter begins.
How Realistic is a $350,000 Bitcoin?
According to the Stock/Flow model, it is more than possible. The crypto market is known to be moving up by around 600%. In Q4 of 2013, after breaking its $200 resistance, BTC rose to an ATH of $1,200 before the bear market began.
Similarly, in Q4 of 2017, BTC broke its $3,000 resistance and rose by about 600% to about $19,000. Now in Q4 of 2021, BTC is currently right below its $60,000 resistance level. If history repeats itself, then BTC will rise by 600% above the resistance level. This will set the price of BTC at about $360,000.
Conclusion
Volatility in the markets can either be a friend or an enemy of price action. In the coming months, in the fractals are anything to go by, we shall see a $250,000 – $360,000 BTC. It is also noteworthy that such a BTC rally will push the entire market by exponential proportions. As it is famously said in the crypto circles, “The Altseason is Upon Us.”


