


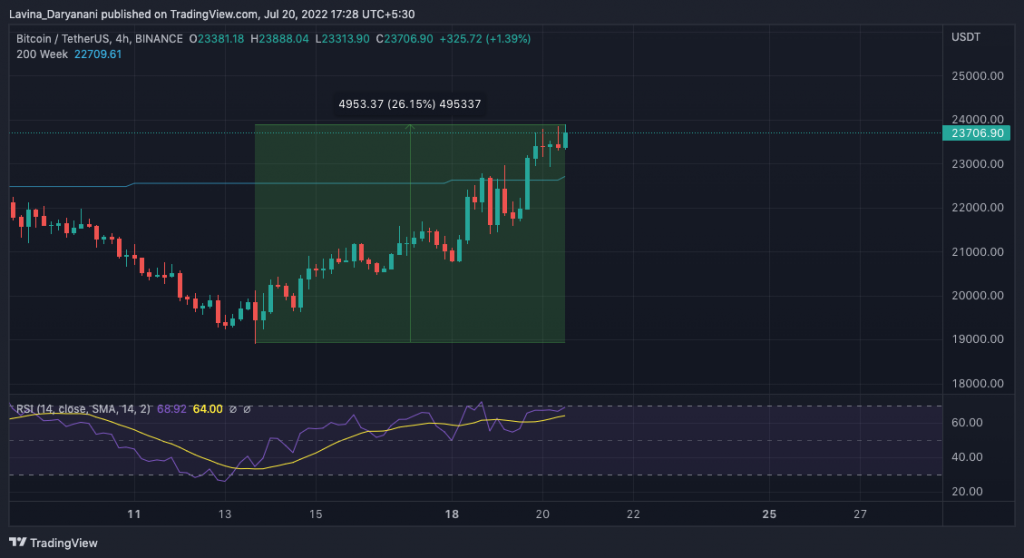
From its local low of $18.9k registered last Wednesday, Bitcoin has rallied by more than 26%. Resultantly, for the first time in over a month, the king-coin traded above its 200-week moving average on Tuesday. The breakout was more or less confirmed at press time on Wednesday, for the asset’s price continued to stay above $22.7k on the shorter timeframe charts.
The past few months have typically been characterized by massive Bitcoin liquidations triggered by the use of excess leverage. In a window of merely 7-8 months, BTC has dived from its ATH to newly created local lows. So, are sellers finally exhausted now? Is the macro-bottom in already? And, is the current uptrend a fresh start to a macro rally?
Well, to get into the nuances of the raised questions, let’s analyze the state of a few unrealized and realized loss related metrics.
Bitcoin’s almost there, but not completely
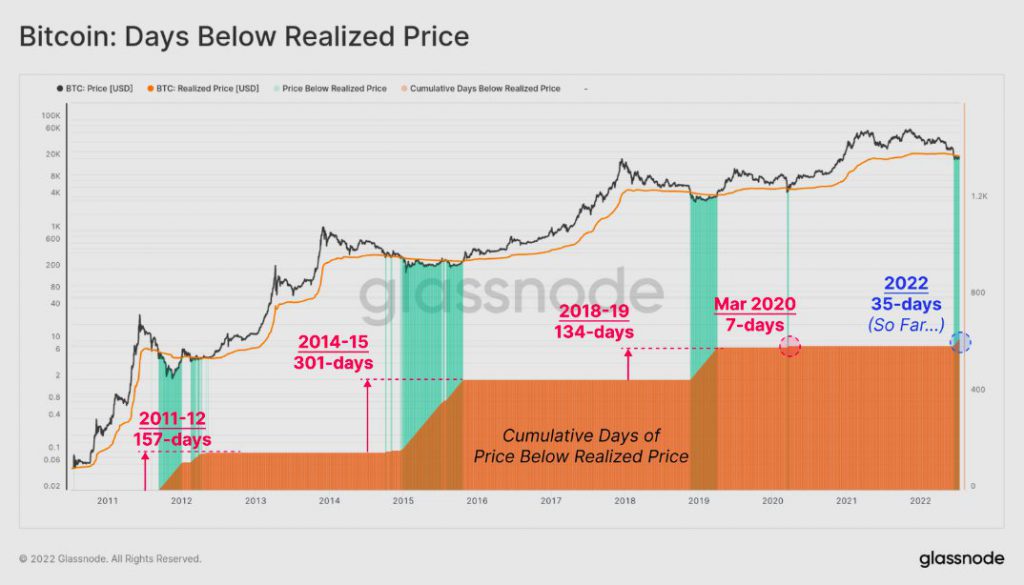
At this stage, Bitcoin is currently trading around its realized price [the average acquisition cost] of roughly $22k. Now, most previous bear cycles have all bottomed out below the realized price. However, the time spent below the said price has varied from 7 to 301 days.
Per a recent Glassnode report, the average time spent below the said level is 197 days, if March 2020’s flash event is excluded. Until the beginning of this week, Bitcoin had spent merely 35 days below the realized price, indicating that it is prepping to bottoming out, but is not completely there yet.
Also, Bitcoin’s MVRV Ratio is currently around 0.953. Usually, values below 1 resonate with late-stage bear markets and are often associated with bottom formation, and accumulation. However, the current bearish divergence, per Glassnode, is not as deep as the average, indicating that,
“further downside and/or consolidation time is required to establish a bottom.”
Supporting the same narrative was the state of the adjusted SOPR. As such, this metric reflects the degree of realized profit of all coins moved on-chain. Values >1 imply that coins are being sold at a profit, and values <1 indicate the contrary.
At the moment, the reading of this metric is hovering above 0.9, but below 1. During previous bear phases, as illustrated below, the aSOPR has capitulated for substantial periods in the said range before pulling off a recovery. So, only when this metric manages to surpass the 1 threshold, it can be contended that the capitulation has wound up. Only then it’d make sense to vouch for a decisive change in trend.

So, what to expect over the next few weeks?
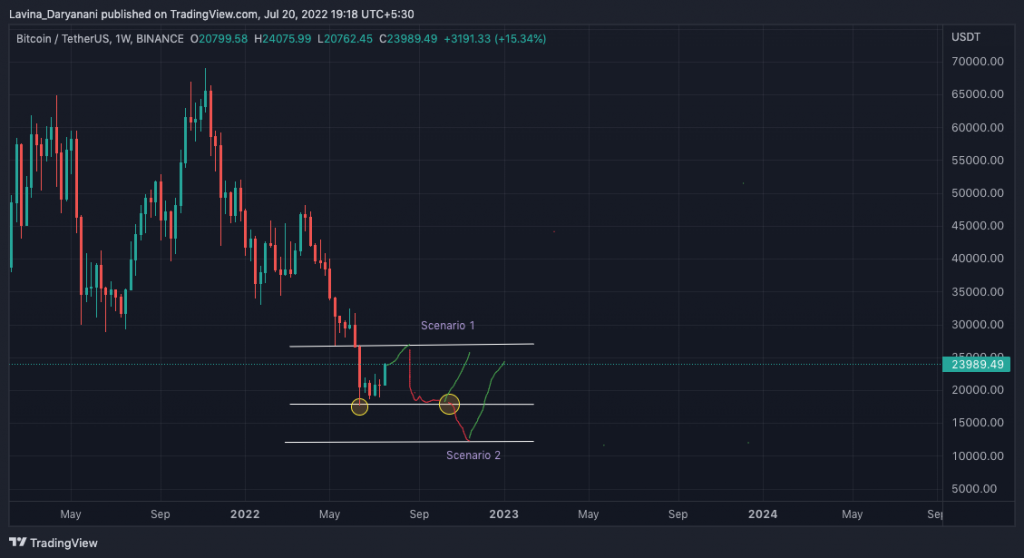
An immediate downtrend might not essentially materialize for Bitcoin over the short term. With the net exchange flows remaining negative, the asset can be expected to continue rallying over the next couple of days until being tested at around $26k. Upon attaining the same, a meltdown can be anticipated, for the said level had acted like a stiff resistance in June.
So, if rejected, in the first scenario Bitcoin would be primed to drop down to $17.6k to collect liquidity. Thereon, depending on the directional bias established, it can either commence an uptrend post bottoming out, or continue to stoop lower to another potential bottom around $11.5-$12k.
So, even though it seems like Bitcoin is on the verge of winding up the ongoing sluggish phase, it might still take some more time for that to pan out. There are high chances of BTC bottoming out at either of the afore-highlighted levels before the bull-run accumulation and concrete change in trend shapes up.
Concluding on similar lines, Glassnode’s report noted,
“Against a backdrop of extremely challenging macroeconomic, and geopolitical turmoil, Bitcoin is reaching peak investor saturation by high conviction HODLers, and it is becoming quite plausible that a genuine bottom formation could be underway.”