


Bitcoin is testing the support at $21,268. Meanwhile, the extended crypto market tried hard to ward off the bears. While the co-relation between Altcoins and Ethereum was stronger than that of Bitcoin and Ethereum, Bitcoin’s volatility did not transfer to the remaining market. Although the exact reason for this sudden drop is unknown, Glassnode’s co-founder has his theories.
Bitcoin Structure and On-Chain Analysis
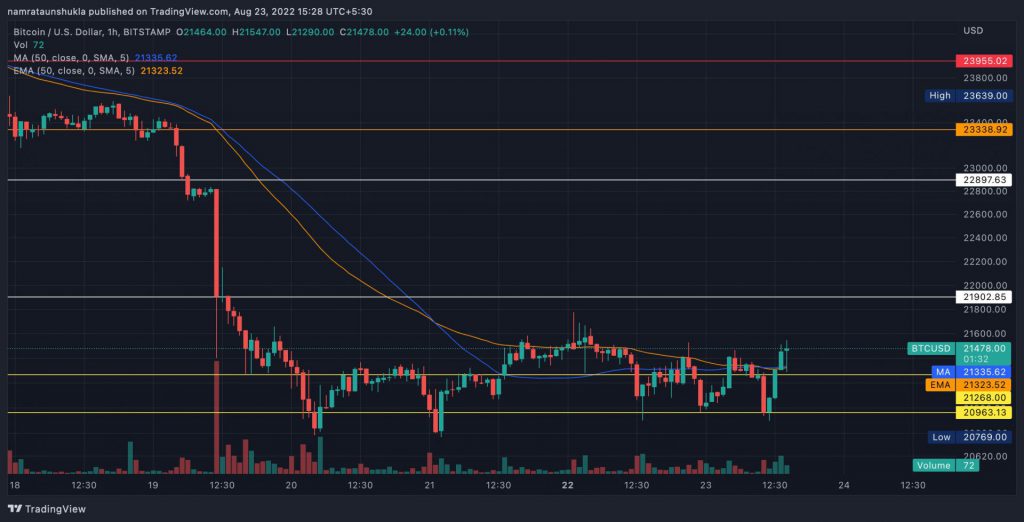
Bitcoin recently reached $25,000. However, a lack of liquidity pushed the asset down to $20,963, a level last seen in June. As per liquidation data offered by Coinglass, at press time Bitcoin’s 24-hour liquidation stood at $29.23 million.
According to Glassnode co-founders, low liquidity and four other reasons triggered the Bitcoin collapse. These included the risk signal for the digital asset crossing over to the high-risk zone, demand created for downside protection, the Ethereum options’ open interest remaining higher than Bitcoin’s, and altcoins losing steam.
While the above reasons helped explain what could have led to the price collapse, what does Bitcoin’s short-term future look like?
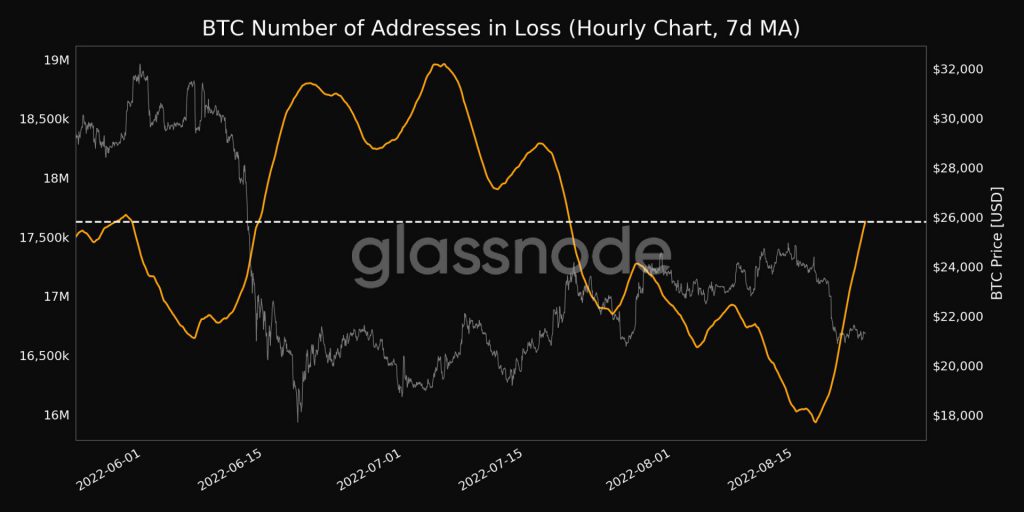
After the recent correction in the market, the on-chain signs were also showing signs of an extremely volatile market. As noted earlier, Bitcoin was testing support close to $21,000, inducing panic in the market. This was because the traders who created positions as BTC rallied towards $25,000 were under loss, more so than any time since late July.
According to glassnode alerts, the seven-day moving average of the number of addresses in loss reached a one-month high of 17.6 million and a massive jump over the past week can be visible.
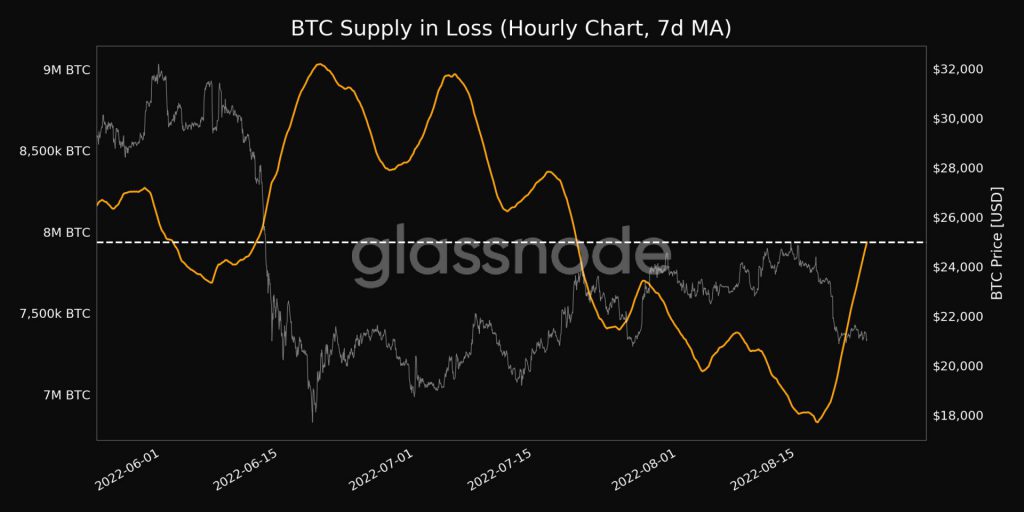
Similarly, the seven-day moving average of the Bitcoin supply that was currently under loss also hit a one-month high at 7.93 million.
While the traders were at a loss, so were the miners. While low fees were a good thing for traders, they were not returning much revenue for the miners. As per glassnode, the seven-day moving average of the total fees paid hit a 2-year low of $11,069.49. Therefore, the profits made by the miners also dropped to a month low of 1.412%.
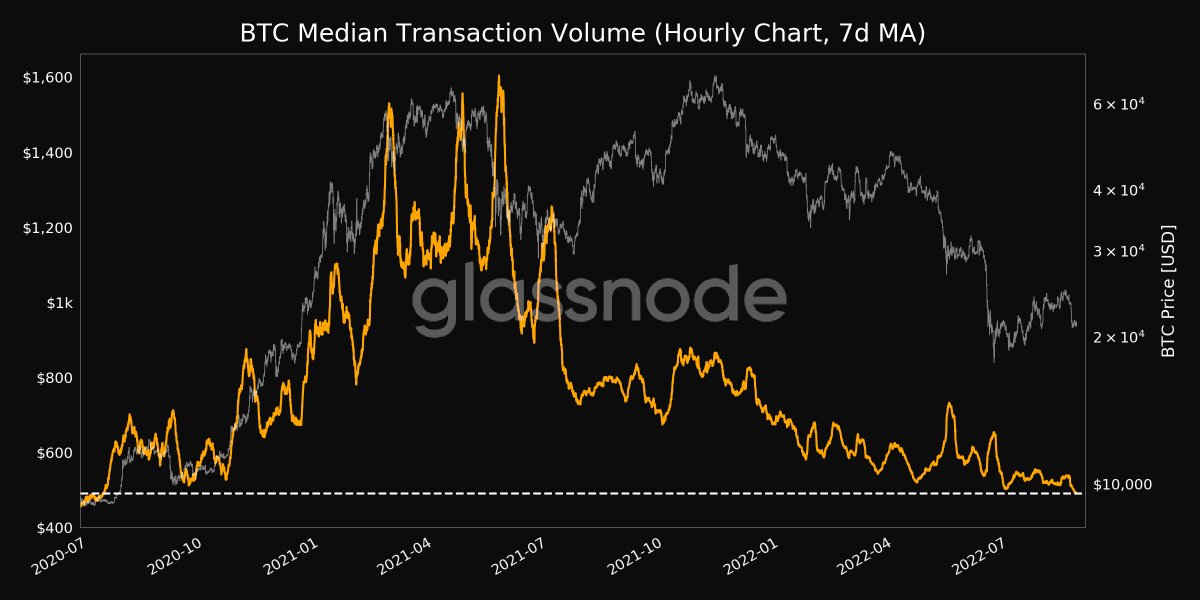
The above metrics indicated the traders were fearful which caused the transaction volume on the network to also drop dramatically. As per the data provider, the seven-day moving average for median transaction volume reached a 2-year low of $489.92.
With liquidity evading the market and fear taking the front seat, caution would be advised to the traders.