


After facing a strong sell-off since the beginning of May, Bitcoin’s price has found some support close to $30,000. While the market was filled with volatility, according to Fidelity’s macro analyst, Bitcoin has reached a level that makes it “attractively valued.”
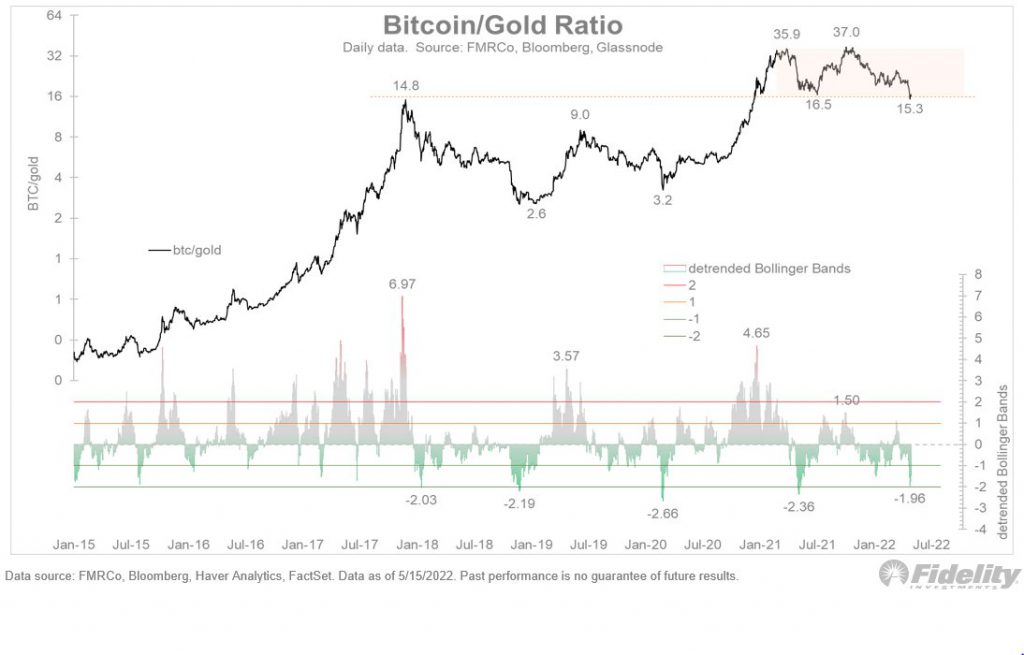
Jurrien Timmer, an analyst at the financial services giant Fidelity took to Twitter to share his understanding of the Bitcoin to gold ratio, which pins the price of both BTC and Gold against each other. Since the two assets are considered to be store-of-value, therefore the current depreciating market conveyed a lot about the developing market.
Timmer started off by stating,
“First up is the bitcoin/gold ratio, which I see as a barometer for how this aspiring digital store of value is faring relative to that “original” store of value.”
As per the image above, the BTC/gold ratio dropped to major support- a level that acted as the 2017 high as well as the 2021 low. This suggested the maturity of the Bitcoin market between this period and the investment it received. Timmer added,
“The BTC/gold ratio is now resting on major support, in the form of 2017 high as well as the 2021 low. At the same time, the detrended Bollinger Band shows that the ratio is now at 2 standard deviations below trend, which is a level that has contained the last 3 declines.”
As informed by Timmer, the current support level has posed historical importance in containing the previous declines. This could be a re-test of the support level which could have two possible results; one, the support holds and the BTC/gold ratio may take off from here, or second, the support fails and the ratio may drop from this point. If the latter comes true, the BTC/gold ratio will drop under the current level for the first time since July 2020.
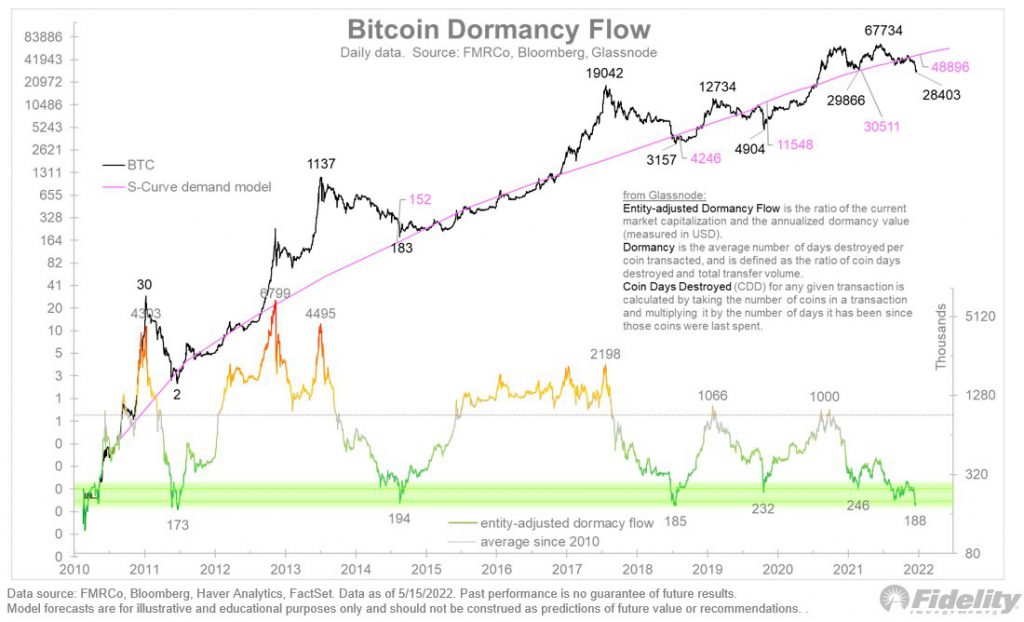
However, despite a fall in the bitcoin-gold ratio, the Bitcoin dormancy flow suggested that the metric was at the lowest level since the 2014 and 2018 lows.
So what does this mean?
Low dormancy values meant that the coins being spent were relatively young. This signaled that older coins are generally remaining unspent, and on-chain volume is characteristic of more day-to-day traffic, per Glassnode. In simple terms, dormancy flow is roughly a measure of strong vs weak hands.
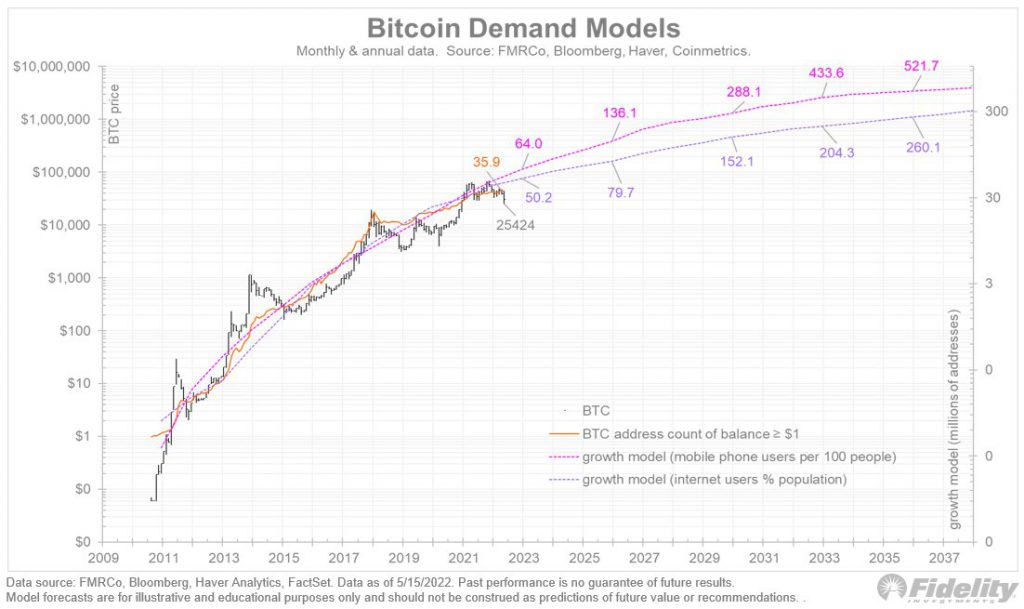
Meanwhile, when Timmer considered the Bitcoin Demand model and compared it with the internet and mobile phone adoption models. He assumed that BTC and crypto adoption was in line with the internet and cell phones, which pushed the digital asset into the undervalued category.
Timmer explained,
“Next up is valuation. With the current swoon to $25k, Bitcoin is now below the price currently suggested by both my mobile phone-based S-curve model and the more conservative internet adoption model.”
Despite the bloodbath in the spot market, the above metrics indicated that Bitcoin was still a crucial asset for the HODLers. A 60% drop in price has only pushed the weak hands out of the market, while the long-term holders maintain a tight grip around the BTC wallet. This can also be visible in the chart below which noted that the number of BTC held for over 10 years maintained steady at 13%.
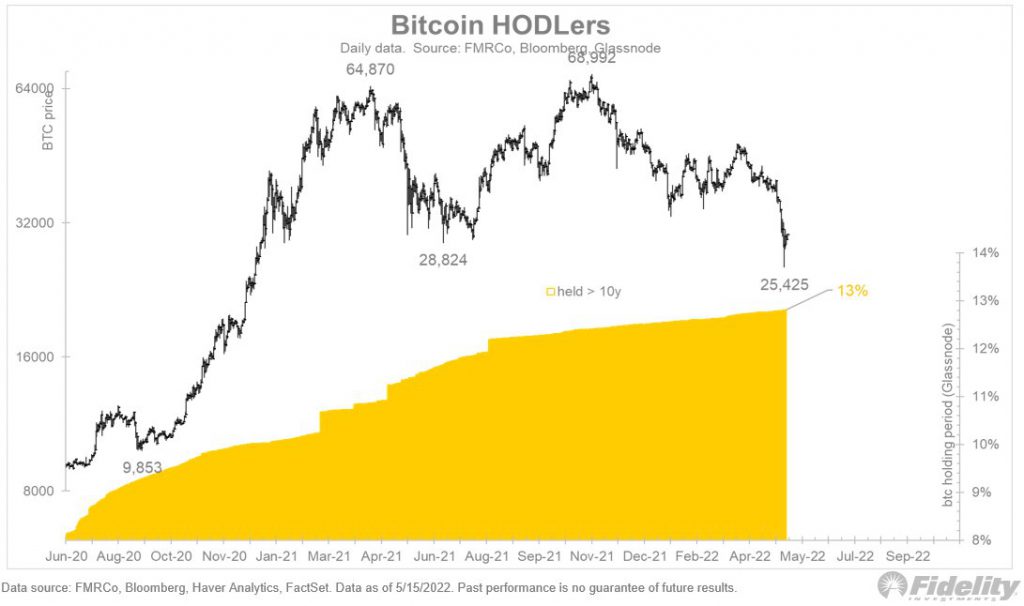
The HODLers are still holding on to their old Bitcoins conveying the importance of the asset in time.
The Bitcoin price currently at $30,562 could be attractive to the investors and if the macro-economic activities along with Bitcoin sensitive equities hold on, we could see the price being supported from this point.