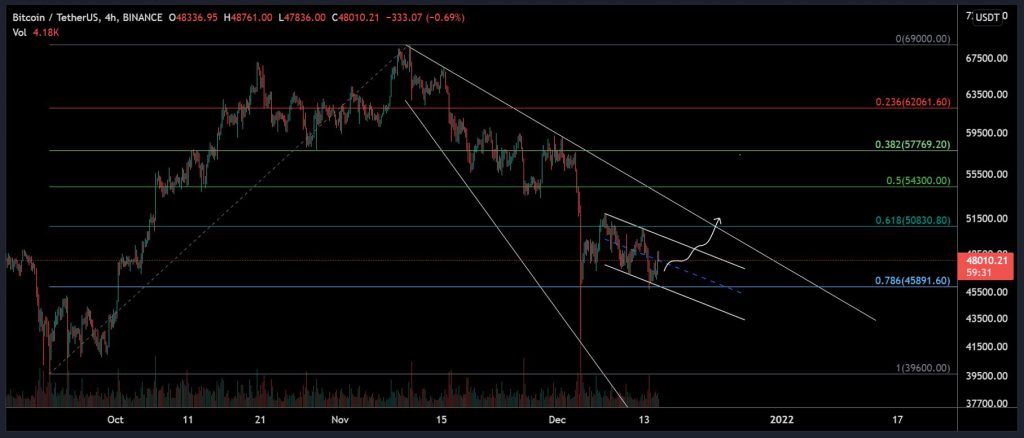
After dropping down to $42,000 on the 3rd of December, Bitcoin‘s recovery in the market has not been significant. It briefly crossed the $51,000 market but it was unable to hold fort at the range for a longer duration. At press time, Bitcoin’s market cap remained under the $1 trillion mark, with a 24-hour trading volume of $29 bilion.
Bitcoin 4-hour time frame


At the moment, Bitcoin’s both long-term and short-term pattern are indicative of a bullish breakout. If the trend is evaluated between mid-November to December 3rd bottom, BTC has been oscillating between a descending broadening wedge. The short-term pattern observed over the past week is a descending channel and collectively both of these trends lead towards a bullish move.
At the moment, Bitcoin is also retesting the 0.785 Fibonacci line which is drawn out at around $46,000. Ideally, Bitcoin should be recoverying towards the $50,000 mark again but a lack of momentum is major concern. Any price consolidation above the $51,000 will be a positive start that should be looked out for going forward in the trend.
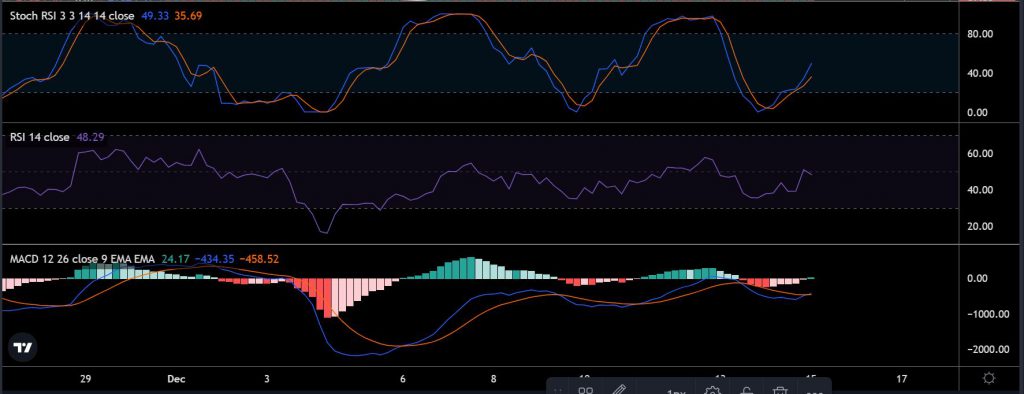
Market Indicator


While there is lack of momentum based on trading volumes, the market indicators appeared collectively bullish. Stochastic RSI illustrated a bullish trend as the Average High(Blue line) indicator hovered over the Average Low(Orange) indicator. Relative Strength Index or RSI remained neutral as selling pressure continued to dominate buying pressure in the charts.
Lastly, MACD indicator just turned bullish in the chart as the MACD line completed a bullish crossover with the signal line. Overall, the indicators remained contradictory.
How to invest in Bitcoin right now
It is difficult to indicate an immediate trend for Bitcoin at the moment. The price may undergo a strong recovery in the next few days based on its pattern formation but it requires market momentum. Further rangebound movement is possible going forward, and a bullish turnaround will be foreseeable only above $51,000.


