


Bitcoin was currently testing the daily 50-SMA after rallying above $40K for the first time since January’s flash crash. A rejection at this mid-term MA could invite a correctional phase as investors bag their gains. At the time of writing, BTC traded at $42,750, up by 3% over the last 24 hours.
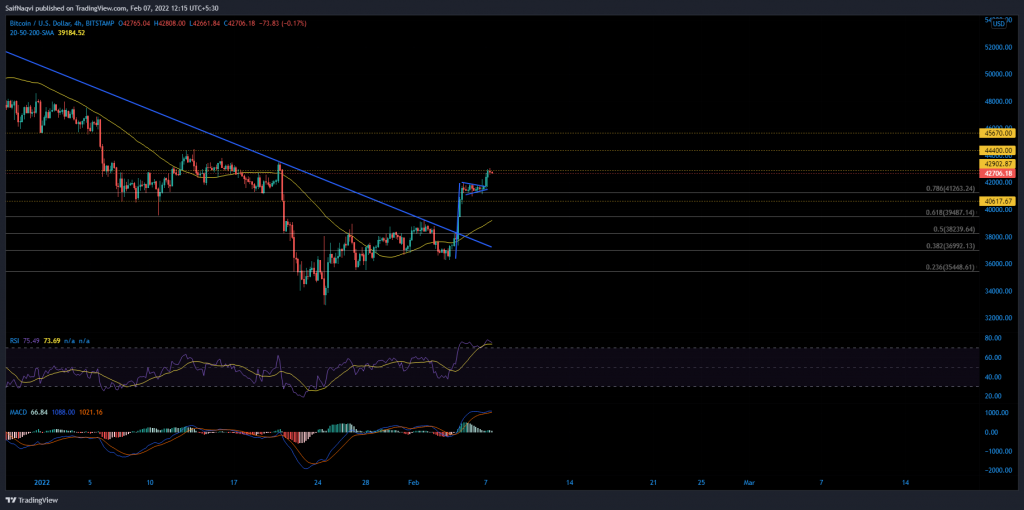
Bitcoin 4-hour Time Frame
Bitcoin saw its biggest daily gain in early 52 weeks on Friday after its price smashed past $40K on strong buy volumes. The lesser time frame even captured a bull pennant breakout over the weekend, accounting for a total hike of 18% over the past three days.
As a result, Bitcoin flipped a 3-month active resistance trendline to support and painted a bullish picture this week. However, the daily 50-SMA (now shown), floating around $43K, could trigger a correctional phase before the next leg forward. Data from IntoTheBlock revealed that 65% of BTC holders were profitable at the moment, making the digital asset vulnerable to profit-taking.
Hence, the 78.6% Fibonacci level and $40,600-support would be important areas over the next few days. An early cut-off of these levels would preserve BTC’s favorable outlook when it challenges $44,500 and $45,670 this week.
At the same time, any close below the 61.8% Fibonacci and 4-hour 50-SMA (yellow) could create panic once again. BTC’s defenses at $36,200 and $35,500 would become the next points of contact.
Indicators
BTC’s 4-hour indicators highlighted the reduction in buying pressure. The RSI was unable to extend into the overbought zone while the MACD grappled with a possible bearish crossover. With BTC trading close to the $43K price barrier, such readings were not ideal for an upwards breakout.
Conclusion
Bitcoin could hit a pause between $41,200-$40,600 before tackling higher levels. The following correction would flush out near-term selling pressure and lead to a more organic rally this week.