


Bitcoin’s price hangs in the balance as investors eagerly await the next bull run. For the moment, buyers and sellers were at a stalemate, with Bitcoin ranging between $42K-$45K. The chart showed that the side to break the deadlock first would likely dictate the king coin’s future trajectory. At the time of writing, BTC traded at $43,290, down by 1.6% over the last 24 hours.
Bitcoin Daily Time Frame
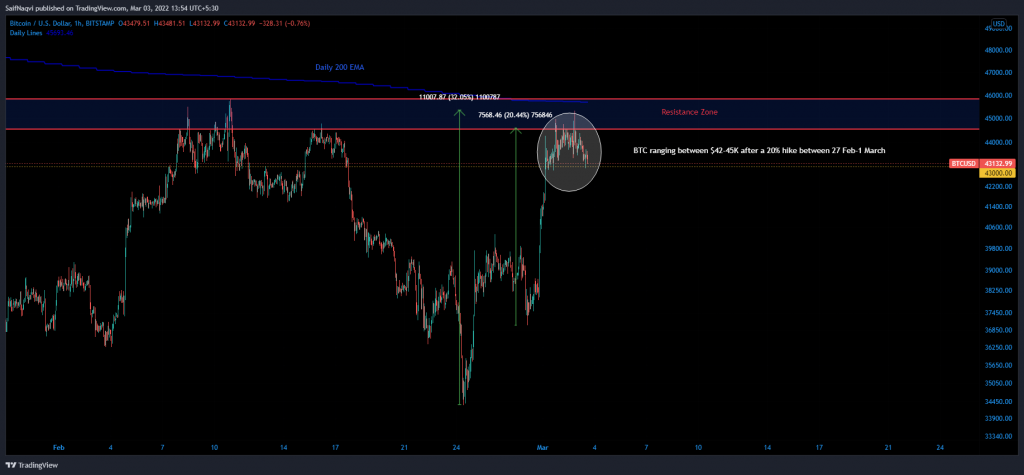
Isolating Bitcoin’s chart post 24 February’s flash crash showed that the bullish side put in a great deal of work to recover the market from recent lows. Since the crash, Bitcoin’s price has recuperated by 32%, climbing from $34,000 to a near 1-month high at $45,300. From the looks of it, Bitcoin’s price is making healthy progress. Furthermore, the laws of technical analysis dictate that price would continue to move higher if consolidation occurs right after a bull run. With that in mind, Bitcoin’s rangebound movement between $45K-$42K carried a bullish preference since it was preceded by a 20% upwards run between 28 Feb – 1 March.
However, that does guarantee a bull run by any stretch. The daily 200-EMA (blue) resided close to $45,600. The aforementioned price barrier was also part of a resistance zone supply zone spanning from $45,600-$47,800. Since sell pressure trumps buying pressure in supply areas, a breakout was not so straightforward.
Investors Accumulating More BTC
During times of uncertainty, whale movements often dictate where the market price is headed. Earlier precedence was established whereby whales and fishes were buying BTC between $35K-$40K. This was further illustrated through a Glassnode chart which showed that the number of addresses holding 0.1 Bitcoins touched an ATH of 3.36 Million on 3 March.
SOPR Flips Positive
Another Glassnode chart indicated that the number of Bitcoins used for a transaction over the last 24 hours touched a 9-month as well. Simply put, some investors were moving their Bitcoins to other addresses, selling them, or exchanging them for other coins.
Bitcoin’s SOPR (adjusted spent output profit ratio) made more sense of the earlier chart. The latest Bitcoin SOPR ( adjusted spent output profit ratio) flipped positive on 3 March after dipping to a 5-month low of 28 February. This meant that those selling their Bitcoin were doing so at a profit once again. A SOPR reading above 1 is generally a healthy sign and is often seen in bull markets.
Price Strategy & Conclusion
A large fraction of investors accumulating Bitcoin during consolidation is generally a good sign for an upcoming rally. Bitcoin’s SOPR recovery backed a favorable outlook as well. Moving back to the chart, Bitcoin had to close to register a daily candle above $45K to kickstart another upwards run. Should its price clear the upper boundary at $52K, investors can expect BTC to challenge $70K in the coming months.
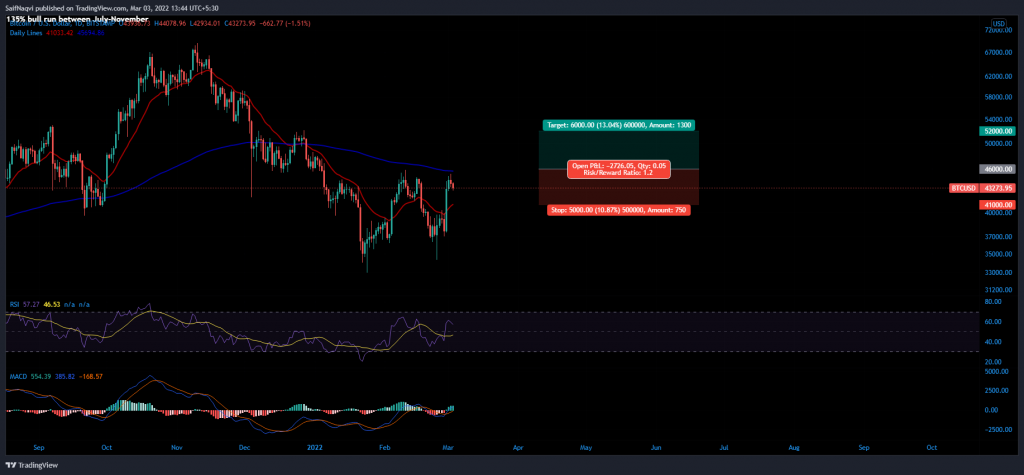
Presently, the daily RSI traded in the bullish ground and posed no risks for a breakout above $45.8K. A buy signal was also present on the MACD, with the fast-moving line (blue) crossing above the Signal line (orange) on 28 February.
To take advantage of such signs, investors can create buy orders for BTC above $45.8K. Take profit can be set at $52K while a stop-loss can be set at $40K, slightly below the 20-EMA (red). The trade setup offered a risk/reward ratio of 1.2.