


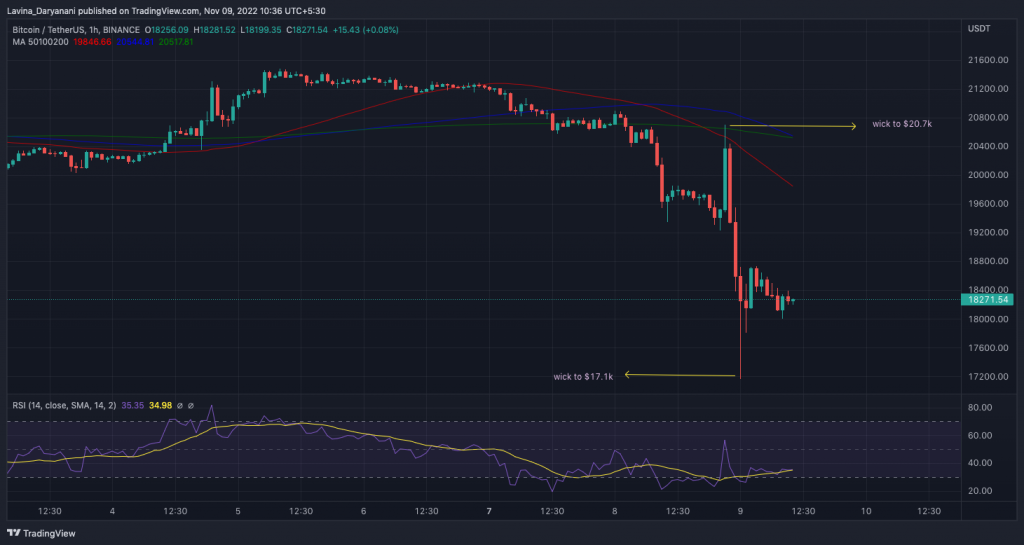
When Binance announced that it was going to acquire FTX, the crypto market initiated a recovery. Bitcoin jumped by more than $1,000 in minutes and went on to claim $20.7k, following the buyout news.
Also Read: Bitcoin, Ethereum create new November lows as market crashes
Even though Binance tossed a life jacket and saved FTX from drowning, the community did not take it well. There were discussions all over social media platforms about how Centralized Finance [CeFi], as a whole, was in danger. Fear and panic led investors to pull out funds from exchanges and pessimism started spreading like wildfire. As a result, asset prices started dropping again.
Bitcoin stoops down to $17.1k
Right after Bitcoin created its $20.7k local high, it started retracing. On the hourly, back-to-back red candles were registered [ref. chart 1]. At one point, the asset was trading at 17166.83 on Binance.
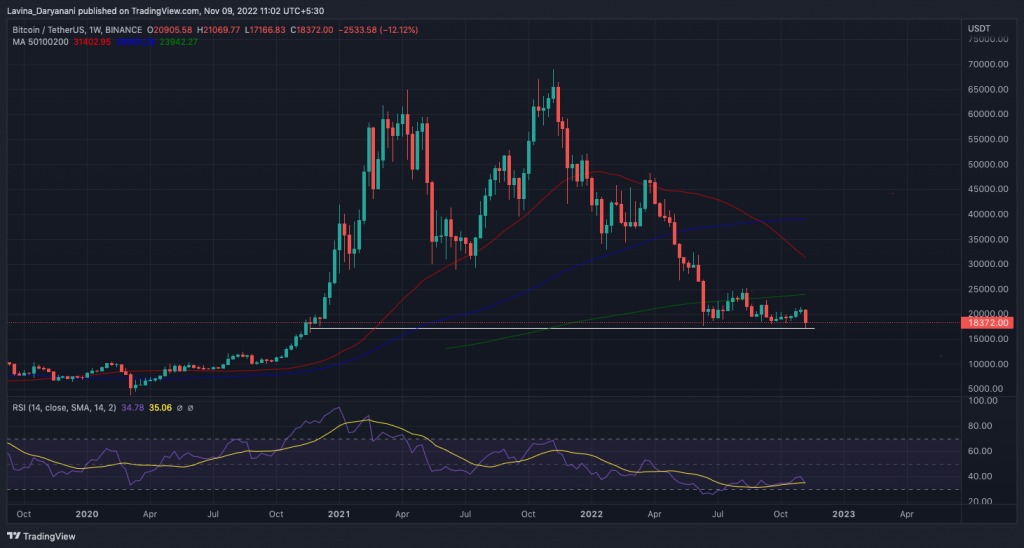
As illustrated below, the said level was last seen back in November 2020. This means that all the gains made by investors during last year’s bull run have completely been wiped out at this stage.
Were traders prepared?
Likely not. Per Santiment, on several exchanges—both CeFi and DeFi—the ratio of bets against Bitcoin stood at multi-month high levels. Initially, long liquidations peaked when the 2-year low was created.
However, when the conditions mildly improved, “overzealous traders” expected further drops. Consequentially, they tried to make up for their losses by shorting the asset. Nevertheless, things again went haywire and the market got rekt.
Is there a bright side to this picture?
Maybe, yes. Bitcoin was already trading above the psychological $18k mark at press time. Sweeping lows helped BTC collect liquidity, which means there are odds of an organic recovery shaping up.
Bitcoin’s MVRV Z score is currently hovering at -0.206. This metric, as such, is used to assess when an asset is overvalued or undervalued relative to its fair value. It does so by measuring the deviation between its market cap and realized cap.
Low values generally indicate that an asset is undervalued and the market bottom is near. As illustrated in the chart below, whenever Bitcoin’s MVRV has revolved around the current number, brief relief rallies have mostly been noted.
So, with the asset trading below its fair value now, there’s not much incentive to sell and recovery might just be around the corner for Bitcoin.