


Over the past week, Bitcoin has consolidated strongly within the $60,000-$64,000 range. At times, it seemed like BTC might break below the $60,000 level but it managed to jump right back. With the market indecisive of a short-term trend at the moment, Bitcoin might break away from its current stagnant state in the next 24-48 hours. At press time, Bitcoin had a market cap of $1.17 trillion with a 24-hour trading volume of $27 billion. Its 24-hour returns were 2.2% increment, with a minor 0.7% hike over the past week.
Bitcoin 4-hour chart
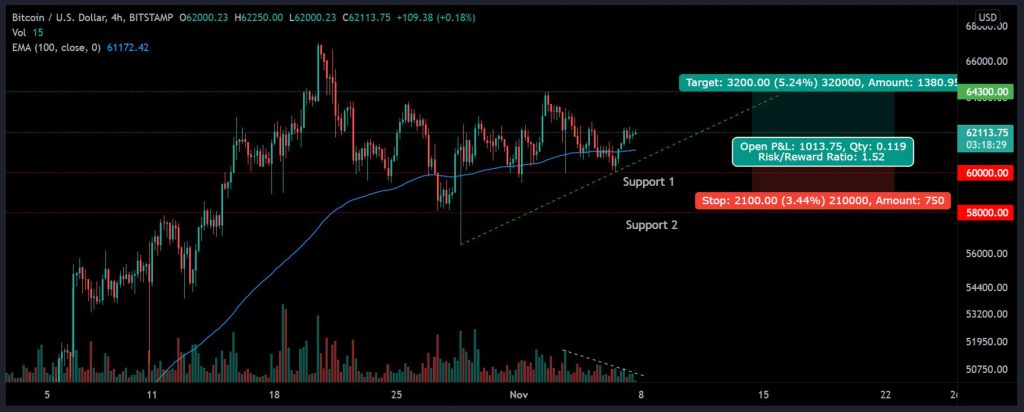
In order to evaluate BTC’s short-term direction, we are analyzing its 4-hour price chart. As observed, Bitcoin retraced from the $60,000 range multiple times since the end of October. $60k support was also tested yesterday on 6th November. However, strength has been displayed by BTC. The asset continued to move above the 100-period Exponential Moving Average(blue line), which is bullish. Dropping trading volumes is a concern since it means buyers are not aggressive.
Market Indicators
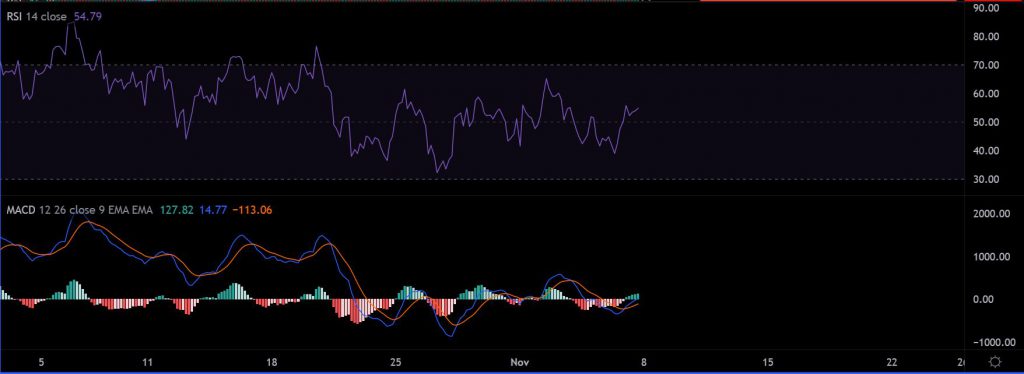
According to the market indicators, Bitcoin is currently in a bullish zone. Relative Strength Index or RSI is currently above 50. RSI defines the momentum between buying pressure and selling pressure. A value above 50 is considered bullish as more buyers are piling in.
Moving Average Convergence Divergence or MACD suggested a similar trend. MACD is a momentum trend indicator. Whenever the blue line is hovering above the orange line, it is a bullish sign.
Important levels to look out for
Considering Bitcoin is bullish in the short term, traders can open a long position in the market. The possibility of reaching $64,300 is high over the next 24-48 hours. Entry position at $61,100 is feasible with a stop loss at $59,500. The risk/reward ratio for the trade is 1.52x. However, considering a clear trend is still not available, traders should opt for reduced leverage.