


BNB is Binance’s native token, and recently it had some signs of a potential price jump. Will it stick? We will answer this question as well. Chart analysis reveals a pattern that might suggest a possible 19% surge. This bullish signal has caught our attention, and the same can be said about other investors.
Also Read: XRP to Skyrocket? Predicting Prices if Crypto Market Hits $12 Trillion
Understanding BNB’s Surge: Insights on Binance Coin and Market Trends

The Inverse Head and Shoulders Pattern
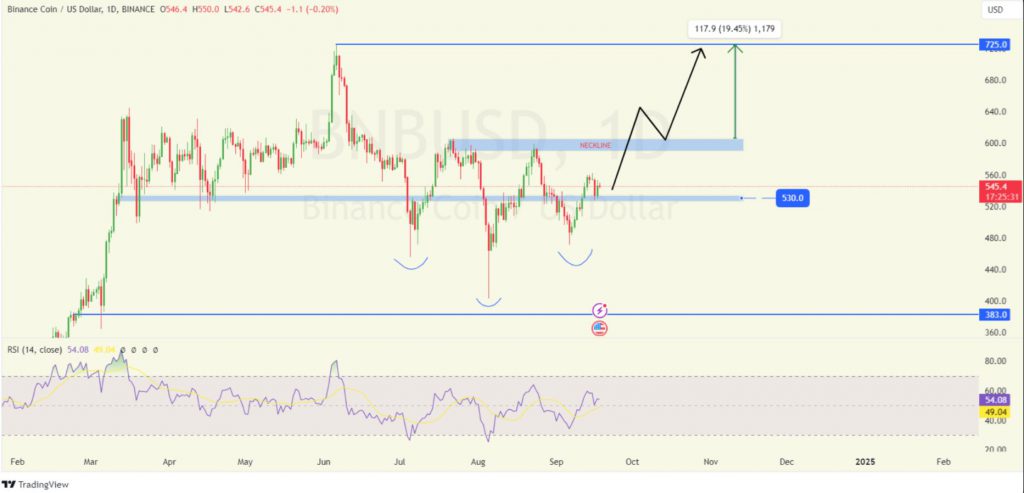
The BNB price chart displays a reversed head-and-shoulders pattern, which is very interesting indeed. This formation has three dips, with the middle one being the lowest from the three. Traders often see this as a sign of a trend change from bearish to bullish, but please take this idea with a grain of salt.
Key Price Levels
The pattern’s top line is at $560. Investors must watch this crucial level. If BNB breaks above this point, it could trigger a rise towards $725. Traders are closely monitoring this key level.
Potential Upside and Downside Scenarios
If BNB breaks through $560, traders expect it could reach $725. This would be a 19.45% increase from current prices. That said, BNB really must stay above the level of $530 to keep this positive trend going. If it falls below the $530 level, this could lead to further price drops.
Also Read: Gold Prices Hit Record Highs After Feds Cuts 50 Bps
Market Sentiment Indicators
BNB’s RSI is around 54, showing neutral momentum. This means the price could move either way. The RSI doesn’t suggest overbought or oversold conditions, adding to the short-term uncertainty.
Funding Rate Analysis
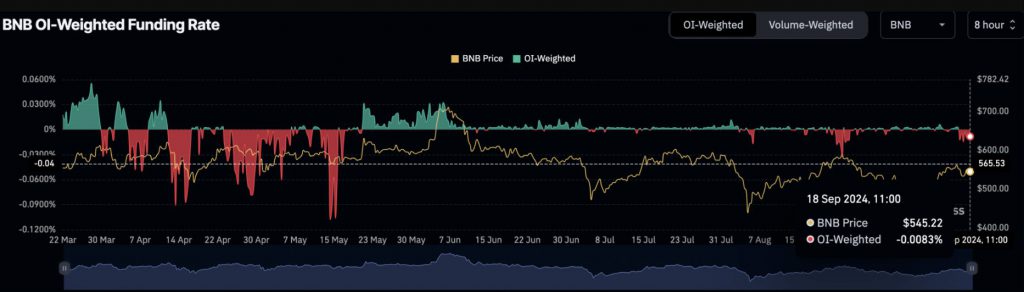
Recent data shows the BNB funding rate at -0.0083%, hinting at a slight bearish bias. This suggests short positions have a small edge. But sentiment could quickly change if more buyers enter the market. Traders use funding rates to gauge market mood.
Trading Considerations
Traders are watching for a daily close above $545. This could confirm bullish momentum. Some analysts suggest a trade setup with entry above $545, targeting $600, with a stop-loss near $525. Given crypto’s volatility, proper risk management is crucial.
Also Read: Popcat Eyes 50%, Baby Doge Consolidates: Which Crypto Surges Next?
BNB is at a critical point as we speak and write this guide. As they should, those interested in the market are watching these indicators closely. The next few days may decide BNB’s short-term price direction. We will be here to report on that!