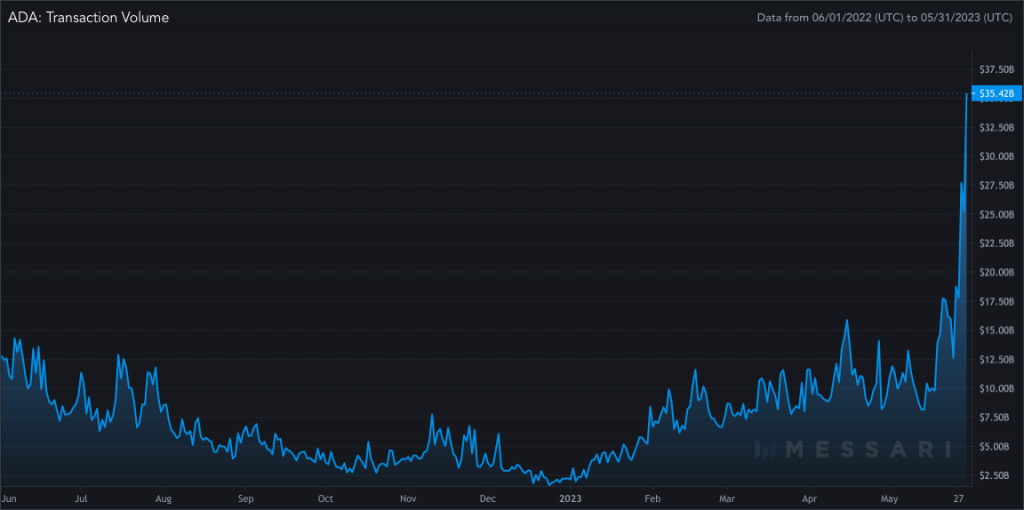
While Bitcoin experienced the emergence of BRC-20 tokens and the rise of meme coins, Cardano [ADA] stood out by flourishing in its own right. The notable surge in network activity on the Cardano blockchain garnered significant admiration from observers. At present, the network managed to surpass Bitcoin on Messari’s Chain Activity list.
Based on recent data, Cardano showed a remarkable daily transaction volume of $35.42 billion, surpassing Bitcoin’s volume of $9.93 billion. Furthermore, Cardano’s adjusted transaction volume, which takes into account various factors, has also been substantial, reaching approximately $34.30 billion. These figures noted Cardano’s significant transactional activity and its potential as a promising network within the crypto ecosystem.


It is worth noting that Cardano currently has a smaller number of active addresses compared to Bitcoin. With 73,141 active addresses, Cardano’s user base is relatively smaller in comparison to Bitcoin, which reported 912,071 active addresses. Despite the disparity in active addresses, ADA registered increased user activity when compared to the king coin.
In another notable development, Cardano has not only demonstrated its potential compared to Bitcoin but also surpassed the Ethereum [ETH] network. According to recent findings by Santiment, Cardano beat Chainlink [LINK] and Ethereum in terms of development activity during the month of May.
Additionally, the network has been thriving in the decentralized finance [DeFi] space as well. Through the past week, the trading volume on Minswap, a prominent decentralized exchange [DEX] on Cardano, witnessed a substantial surge of 82.28%. In terms of total value locked [TVL], Cardano currently ranks 16th among all blockchain platforms. Leading this surge, Minswap experienced a week-over-week increase of 12.28. Consequently, over the course of one month, its TVL showed an impressive growth of 28.05%, reaching around $64.95 million.
How is ADA faring amidst this hot streak?
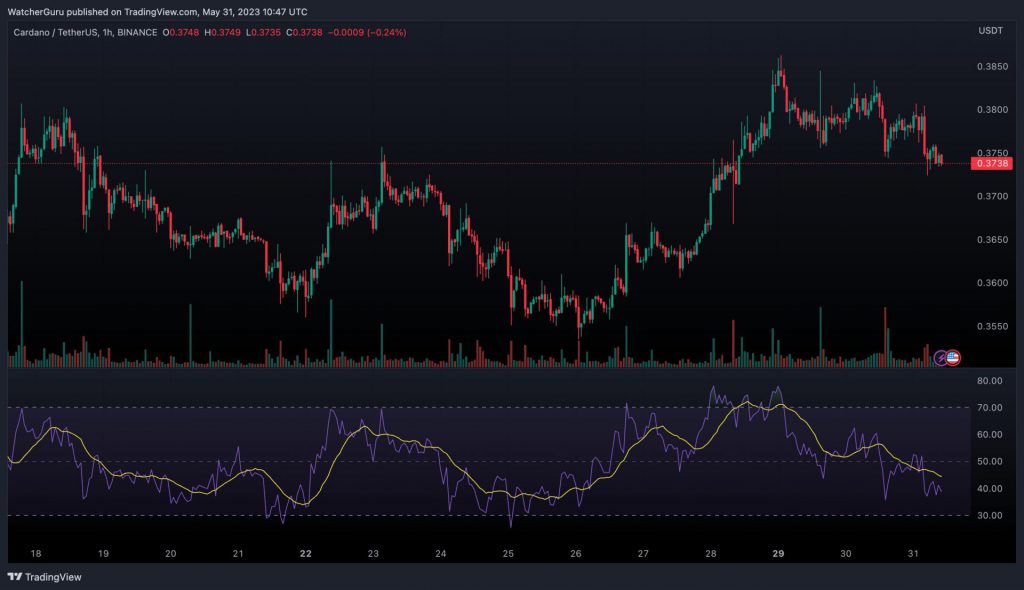
Currently, ADA was experiencing a similar downward trend seen across the market. With Bitcoin leading the way with a 3.21% daily decrease, ADA and other assets followed suit. At press time, ADA was trading at $0.3744, reflecting a 2.25% daily decline.


The price movement of ADA appeared to be in a sideways pattern, as indicated by the chart. In this situation, the Relative Strength Index [RSI] indicator reflected an uptick in selling activity within the market. This suggested that there was an increase in selling pressure compared to buying pressure for ADA during that period.
As ADA’s price continued to decline, the number of holders experiencing losses increased to 69%. This meant that a significant majority of ADA holders were holding the asset at a lower value than their initial investment. Conversely, only a small portion of holders, around 27%, were able to sell ADA at a higher price and realize profits. These figures revealed the prevailing market conditions and the impact on ADA holders’ overall profitability.


