


Cardano’s downtrend has now lasted for a full 145 days, with the last all-time high observed in September 2021. A chain of lower highs dragged ADA to $1.15 on 22 January – its lowest ever point since May last year. Fortunately, the presence of a reliable demand zone prompted a reset and a possible bull run should buyers win out an accumulation stage.
ADA Daily Chart
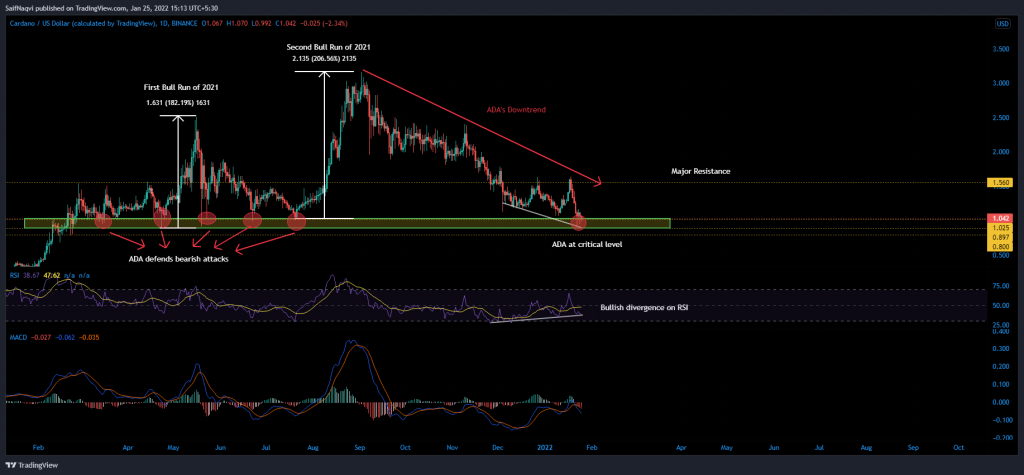
At press time, Cardano’s price sat within a critical area of demand between $1.0-$0.86. This channel has developed into somewhat of a safe zone for ADA after outliving two full bear market cycles – one between late-Feb to March and the other between May-July 2021. Notably, the channel was also responsible for two major bulls runs in which ADA recorded a 182% hike followed by a 260% surge to an all-time high of $3.16.
READ ALSO: Post an 11% hike, Cardano scores big in the fundamental game too
Now, historical levels do play a major role in buying and selling behavior but overall market conditions should also be assessed before making a sure bet. With Bitcoin’s struggle on the chart set to continue until it discovers a solid support level, ADA could likely enter an accumulation period around the $1-fgure. During this stage, new buy orders would be offset by broader market pressure, leading to sideways movement.
In the meantime, observers should keep an eye on some important areas on the chart. For instance, a close above $1.50 would reignite hopes of a bull run whereas a move below $0.80 would pave way for another sell-off.
Indicators
Interestingly, a massive bullish divergence was spotted on the daily RSI, which formed higher lows when compared to ADA’s lower lows. Such divergences usually indicate a changing market trend.
READ ALSO: Cardano establishes support at $1.44 as Hoskinson discusses 2022
However, the Awesome Oscillator’s red bars would keep buyers on notice momentum aided sellers over the short term.
Conclusion
Mixed signals on the daily indicators could lead to a period of sideways movement as ADA looks to reignite a fresh rally from $0.86-$1. Those looking to buy ADA at its current level should maintain a tight stop-loss to safeguard their setups from broader market uncertainties.