


The latest uptrend of Cardano has approached a critical level of resistance. This situation has grabbed investors’ attention and for a good reason. This digital asset has been steadily increasing in price, and this caused people to ask if it can break through the $0.4233 mark.
Also Read: Cardano: When Will ADA Reach $4?
Analyzing ADA’s Potential to Break Through $0.4233
Latest Price Performance
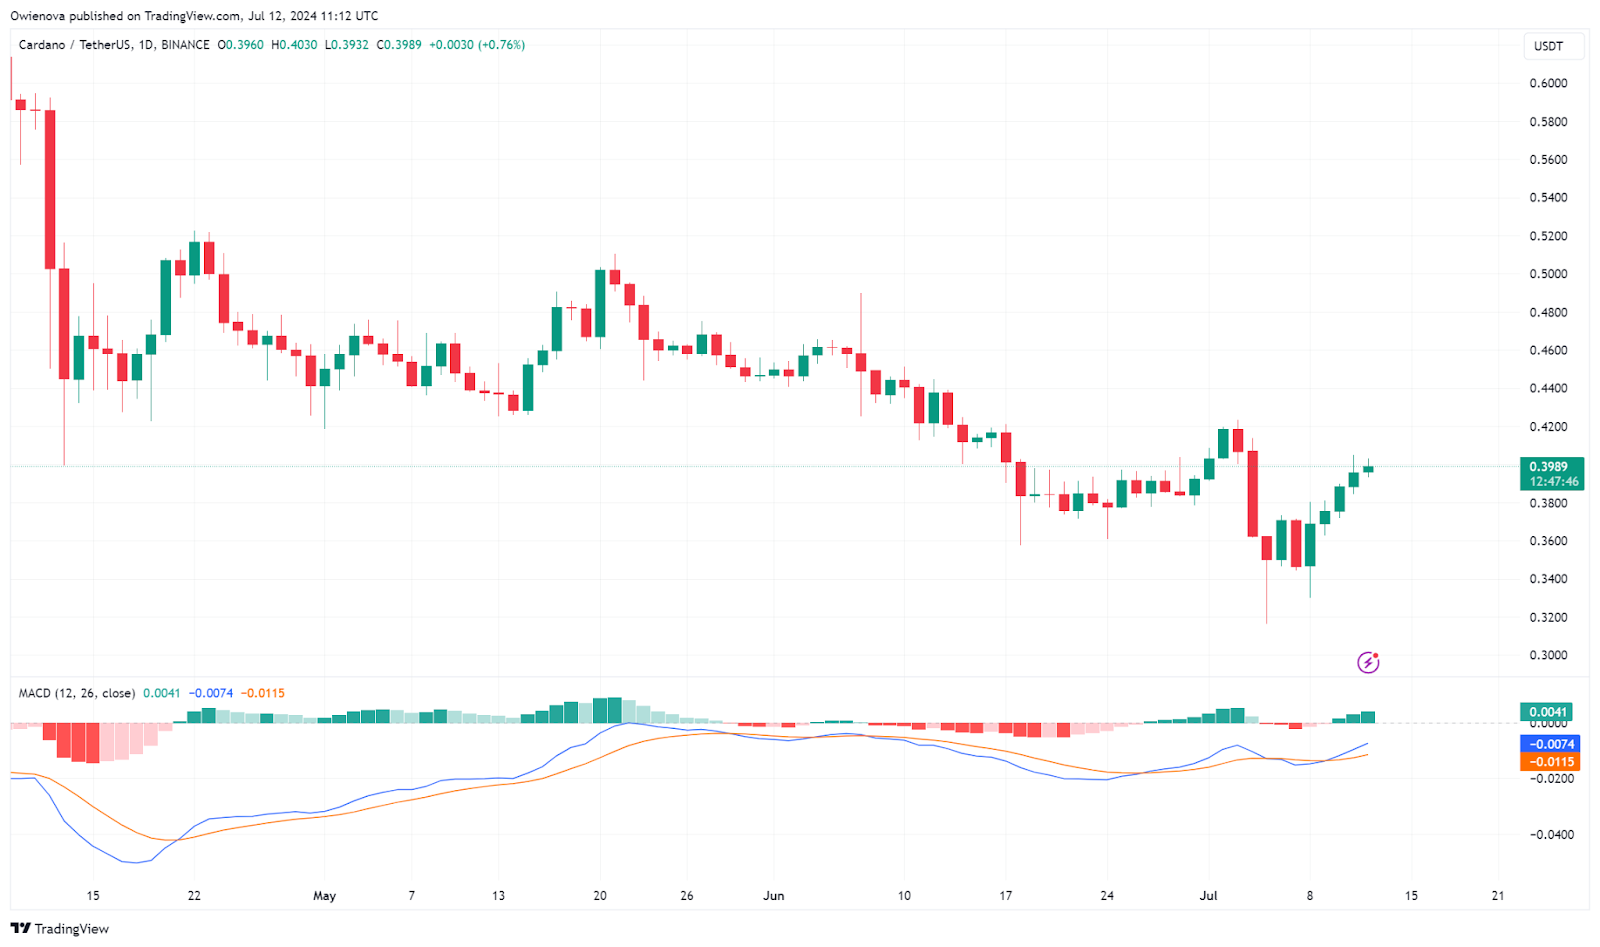
Cardano’s has been making steady gains in recent weeks. When looking at the latest data, ADA is trading at $0.3989, with a market capitalization that passed $14 billion.
The trading volume has increased by 41.13% in the last 24 hours, which shows more interest from the market participants.
Technical Analysis
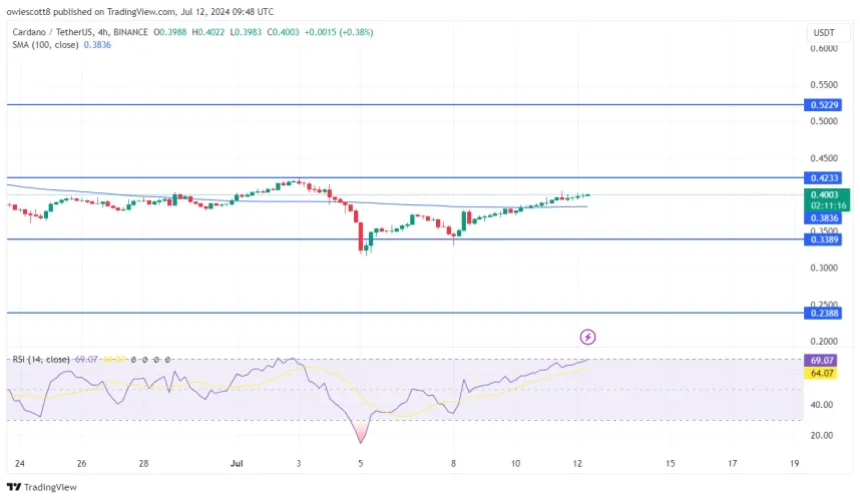
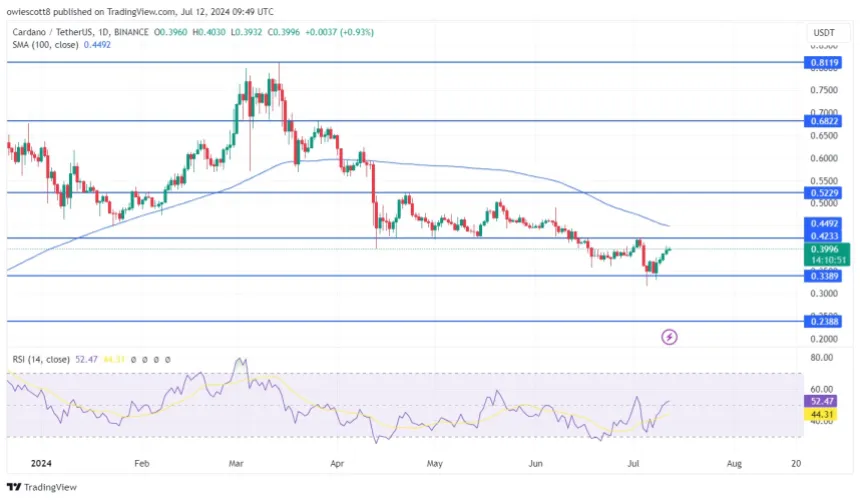
On the 4-hour chart, ADA’s price is slowly but surely rising with strong bullish momentum towards the $0.4233 resistance mark.
The crypto has moved past the 100-day Simple Moving Average (SMA). This action suggests the trend might continue if everything goes well.
The Relative Strength Index (RSI) on the 4-hour timeframe also supports this bullish viewpoint. The signal line maintains a position over 50%.
Also Read: Cardano: Here’s When ADA Will Hit The Ambitious Price Mark Of $3.10
Potential Scenarios for ADA
Bullish Outlook

If Cardano can keep its momentum going and break through the $0.4233 resistance, it may maintain its upward evolution. The next important resistance levels to watch would be $0.5229 and eventually $0.6822.
Bearish Scenario
On the other hand, if ADA faces rejection at the $0.4233 level, a pullback is possible. In this case, the price could retrace to try support at $0.3389. If a break happens below this level, the consequences might include further declines, with the next support found at $0.2388.
Also Read: Cardano: Analyst Predicts Timeline When ADA May Hit The Ambitious $2 Mark
Cardano’s uptrend has brought ADA to an important crossroads. The $0.4233 resistance level is used as a key factor for its short-term price.
The technical indicators show the possibility of the bullish movement continuing. As always, we need to take into account that resistance levels can also create selling pressures.