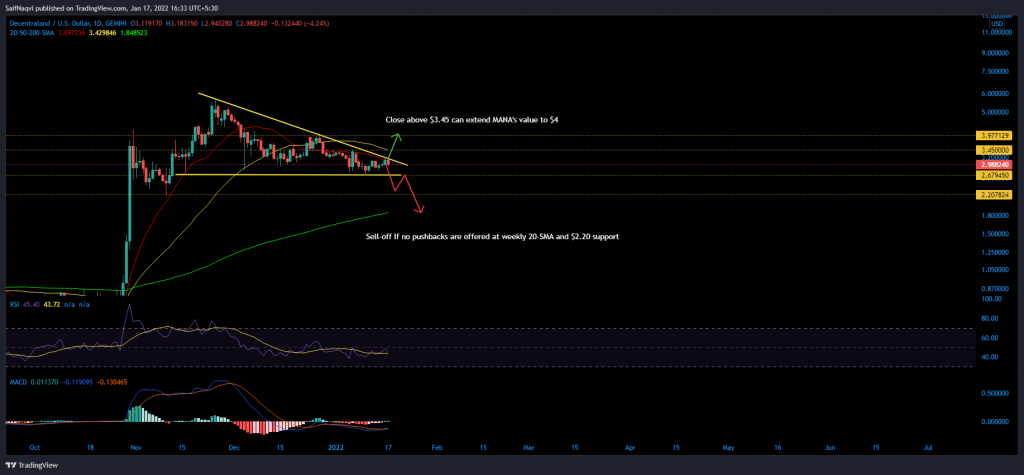
Decentraland’s MANA could be in for a bearish week after forming a descending triangle on its daily chart. However, bulls were not out of the race just yet. Should MANA oppose sellers at an important price level, investors should brace for a temporary rally. At the time of writing, MANA traded at $2.98, down by 1% over the last 24 hours.
MANA Daily Chart


MANA is set to challenge the baseline of its descending triangle after forming a fourth lower high at the daily 20-SMA (red) and resistance trendline. A breakdown from this pattern could see MANA slip below the $2 valuation if no pushbacks are encountered at the weekly 20-SMA ($2.50) and $2.20 support.
However, an invalidation of this bearish setup could surprise investors with a quick rally. A move above $3.45 would see MANA flip its daily 20 (red) and 50 (yellow) to bullish and bulls would be favored at $4-resistance. The outlook would move hand in hand with a bull flag on MANA’s weekly chart (not shown).
Indicators
The daily RSI carried a dismal tone as sellers were actively rejecting a move above 50. Bearish divergences were also visible on the lesser time frame (4-hour).
On the flip side, the daily MACD flashed an early buy signal after its Fast-moving line (blue) crossed above the Signal line (orange). However, keep in mind that the MACD failed to cross above its mid-line after flashing a bullish crossover on 23 December. Hence, those expecting MANA to break on the upside should maintain a tight take-profit.
Conclusion
MANA’s future trajectory had a bearish preference – an active descending triangle and a weak RSI were ominous of an incoming sell-off. However, an invalidation would reward bulls with some short-term gains. Investors should keep a close eye on the abovementioned levels to prepare for both outcomes.


