


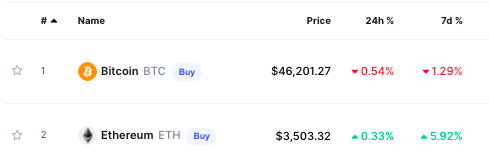
Ethereum has been stealing Bitcoin’s thunder over the past few days. The alt king has moved with much more thrust on the price charts when compared to the king coin. Over the past week, while BTC shed 1.3% of its value, ETH managed to climb up by 6%.
In effect, the latter had been able to crack past $3.5k, while the former was still finding it a task to inch beyond $47k.
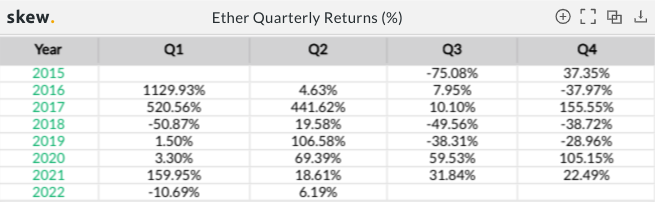
Q2’s magic
The second quarter has always been favorable to Ethereum. In 2017 and 2019, investors fetched triple digit gains [442%, 107%] in the said period, while during all other years [expect 2016’s 5%], it rallied in the range between 19%-69%.
Four days into April, and this year’s Q2 number already reflects a positive value of 6%.
Will Ethereum carry forward the tradition this time too?
Well, even though most market participants are rooting for a macro-bullish phase to unfold, not much can be asserted with surety at this stage.
The implied volatility [IV] in the Ethereum market has shrunk down over the past few days and is currently being overshadowed by the realized volatility [RV]. Simply put, IV showcases the amount of volatility expected by market participants while RV typifies the actual volatility present in the market at a given point in time.
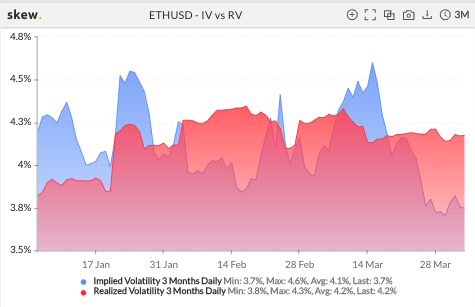
IV v. RV has always helped in indicating initial phases of rallies. In the past, whenever the RV has slipped down the cliff—may it be during December ’20 or ‘April ’21—a bull run has been followed right after.
Currently, the IV and RV stand at 3.7% and 4.2% respectively, highlighting the bearish outlook of the market’s derivatives’ traders. Thus, only when the IV rises back up, it would make sense to anticipate the next concrete bull run.