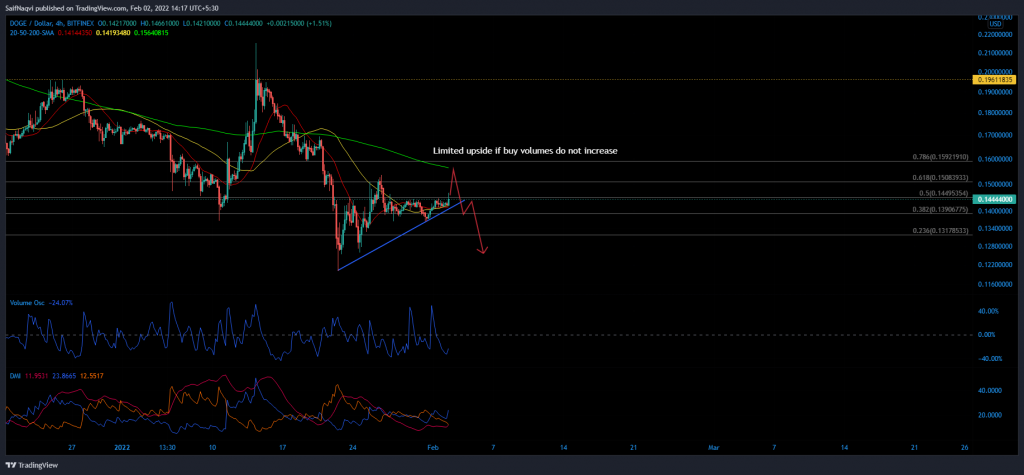
Dogecoin’s price has consolidated for a week now after seeing high volatility between 24th and 27th January. The path forward would be tricky for the bullish side, considering a tight resistance pocket between $0.15-$0.158. Meanwhile, sellers would have an easier task forcing a close below DOGE’s immediate support at $0.136. At the time of writing, DOGE traded at $0.1444, up by 2% over the last 24 hours.
Dogecoin 4-hour Time Frame


Dogecoin’s price remains gridlocked in a tight channel between the 50% and 38.2% Fibonacci Retracement levels. Now, a close look at the chart showed a 4-hour candle forming above the immediate resistance barrier. The development was backed by a spike in the Directional Movement Index’s +DI line, highlighting a bump up in buying pressure.
However, DOGE’s upside would most likely be limited to the 78.6% Fibonacci level, anchored by the 4-hour 200-SMA (green). Chances of an extension were low if buy volumes fail to pick up in the next 24-hours. The Volume Oscillator moved below equilibrium as DOGE poked above $0.145, suggesting that buyers were not behind the breakout just yet.
Meanwhile, the potential for losses outweighed DOGE’s upside, especially if Bitcoin retraces before touching $40K. A close below the 38.2% level would see DOGE slip shift back between $0.125-$0.120. However, an early pushback at $0.136 would be a sign of strength.
Conclusion
One must be extremely cautious while trading on the Dogecoin 4-hour chart right now. A consolidating market should be followed by tight entry and exit points and safeguarded by reasonable stop-losses. Furthermore, a close above $1.45 can suck buyers into a bull trap if trading volumes do not increase moving forward. Hence, a safer call would be to short DOGE if and when it closes below $0.136-support.


