


Ethereum (ETH) has been the greatest finance revolution in the last decade. What started as an idea between Gavin Wood and Vitalik Buterin has now come to be known as the world computer. Ethereum is the largest blockchain in the world in terms of utility and enterprise adoption. Big companies like Microsoft, IBM, and European Investment Bank (EIB) are leveraging the power of the Ethereum blockchain using the Baseline protocol. Many Ethereum killers have tried to outdo Ethereum without success. Currently, Ethereum’s price sits at $3803.
Ethereum Price: Technical Analysis
Currently, the Ethereum price chart seems to be forming a giant ascending triangle on the daily timeframe. An ascending triangle is a chart pattern in technical analysis that predicts the continuation of a bullish trend. Ascending triangles break to the upside and are followed by robust price movements. Ethereum has been in an ascending triangle since May 2021 when it formed an all-time high of $4384. This marked the level of resistance for this chart pattern.
Since May, Ethereum has tested this level twice more. The most recent is October 16, 2021, when it rose and touched $3968. Before that, ETH had risen to $4030 forming a local top. But the resistance was too strong and the price did not breakout. ETH dropped to a low of $2651 before rising to test the resistance once more.
Usually, ascending triangle breakout signal 200% – 300% gains. This would put Ethereum at about $6000 – $8000 price tag. The bulls have proven to have the season. In addition to that, Ethereum’s fundamentals are insanely bullish.
Ethereum Fractal Predicts a $15,000 ETH
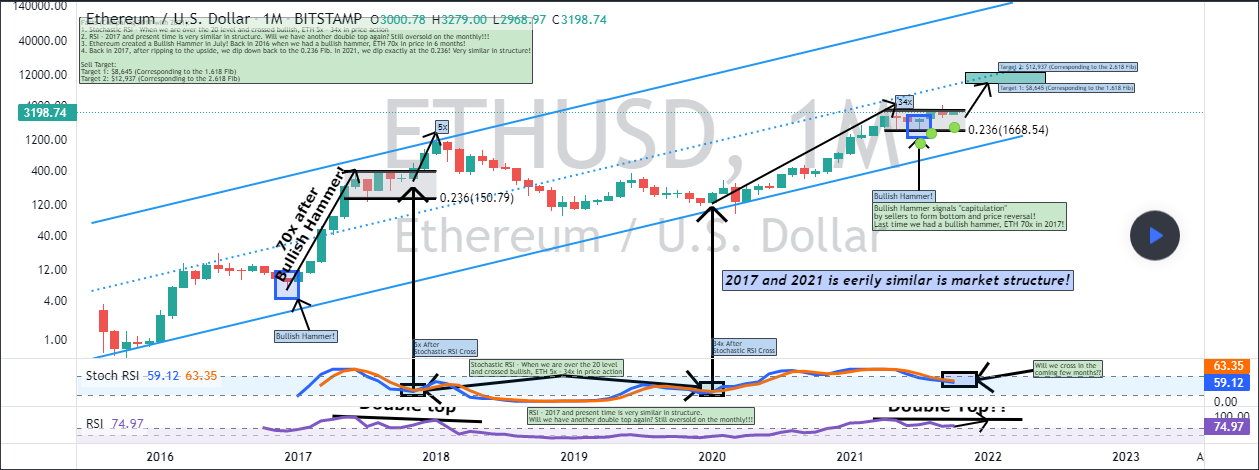
In 2017, the year of the last bull market, Ethereum’s price rose to a high of $1419 before going down to a low of $90. The 2017 bull market left a fractal that seems to be repeating this year. A fractal is a pattern that repeats after a certain amount of time. Every time it appears we expect a certain outcome. This particular ETH fractal consists of four indicators: RSI, Stochastic RSI, Fibonacci retracement level, and the bullish hammer. When these four indicators occur (without any particular order) it signals a bullish run for ETH.
In 2017, the bullish hammer occurrence preceded a 7000% increase in price over 6 months. The price surge caused RSI to be overbought. Consequently, Ethereum price went into consolidation, and RSI corrected lower. Late 2017, the Stochastic RSI turned bullish and a massive rally to the $1400 high began.
As 2021 began, Ethereum’s price has rallied over 3000% after a bullish Stochastic RSI flashed. The price rally to $4384 ATH put the RSI in the overbought zone. This prompted a consolidation period that seems to be in its last stages. If a bullish hammer appears on the ETH chart it could send $ETH to $15000.
Fundamentals also Support a Massive ETH Run
Ethereum is at the cusp of ‘the Merge”. This is where PoW Ethereum becomes entirely obsolete and PoS takes over. About a month ago, Ethereum became deflationary. As supply continues to reduce and use case continues to increase, $15,000 may just be the first stop.