


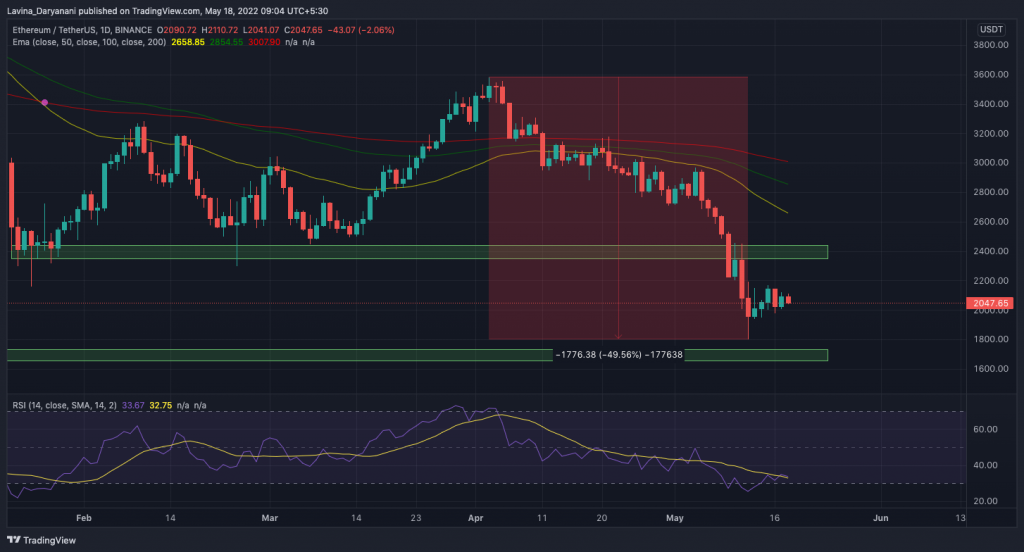
Ethereum investors have been fetching negative returns of late. In the five-week window between the beginning of April to the beginning of May, ETH depreciated by close to 50%. Some sort of relief was noted post that, but the uptrend couldn’t sustain for long.
Over the last couple of days, Ethereum has been trading at the brink of $2k, engulfed between two strong demand zones—one around $2.3k and the other around $1.7k. Thus, any ascend/descend from here on to the said levels would see the alt halt and collect liquidity. Thus, the consolidation phase might end up extending itself there.
How has the Ethereum network been faring?
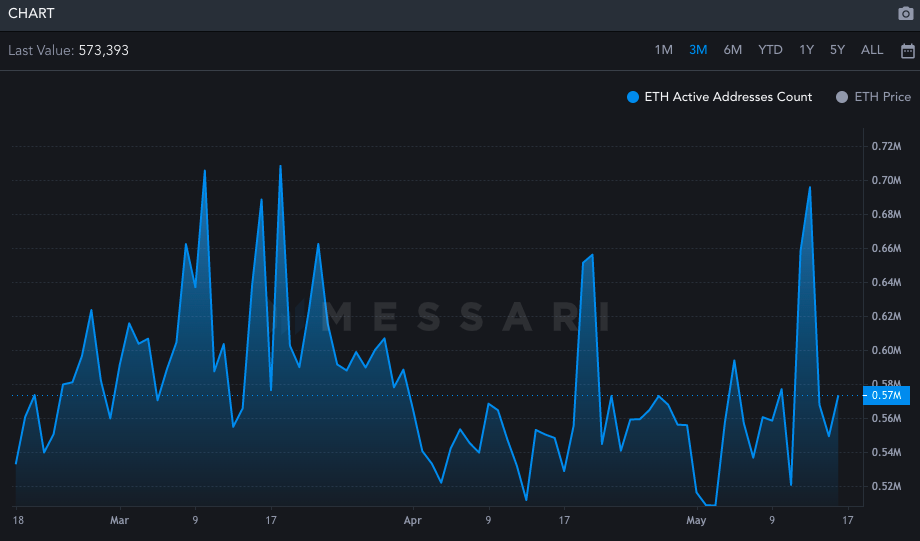
Ethereum’s network activity has been faring reasonably well of late. The number of active addresses witnessed a multi-week peak on 13 May but quickly shrunk down post that. Nonetheless, the press time level was comparatively higher than the average level noted throughout April and the first week of May, bringing to light the improvement in the state of network activity.
Also, it is interesting to note that Ethereum’s NVT just noted a bullish divergence on its chart for the first time since last year’s May. Highlighting the same, Santiment noted,
“After a 10-month stretch of ETH not receiving enough network circulation to justify high market cap levels, our NVT model shows a bullish divergence due to such a dramatic dip occurring.”
This ratio essentially this ratio takes into account the network value, and transactions—or value being transferred onto the network—into account. A high NVT usually suggests that the former is able to outpace the latter and vice versa.
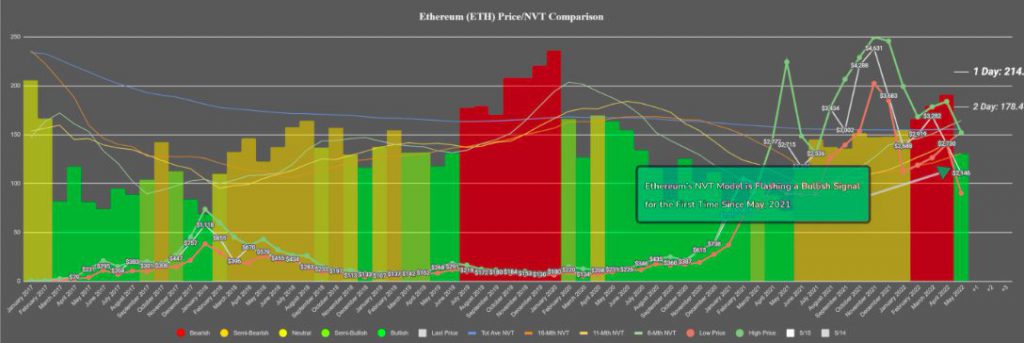
The bullish divergence might not necessarily have an immediate bearing on Ethereum’s price. As can be noted from above, the aforesaid model flashed semi-bullish to bullish signals for a stretch of more than a year in 2020-21. In the said period, Ethereum was in the midst of its macro bull run. Nonetheless, retracements on the micro-frame keep happening here and there as the price climbed up the ladder.
So perhaps, the flash of the bullish divergence on this chart is an indication that Ethereum is gearing up for its next macro-bull leg. As far as the short-term is concerned, however, the bullish/bearish outlook would solely depend on the inclination of the buyer-seller trades.