


2022 brought about several changes in the cryptocurrency ecosystem. The Ethereum [ETH] network in particular introduced significant upgrades. While some instances were favorable to the industry, a few others weren’t. However, the advent of failed centralized exchanges gave rise to increased self-custody activity. It was recently brought to light that the total number of ETH held in self-custody had reached an all-time high. This means that the supply of Ethereum on exchanges is currently at its lowest level.
On-chain analytics firm, Santiment said,
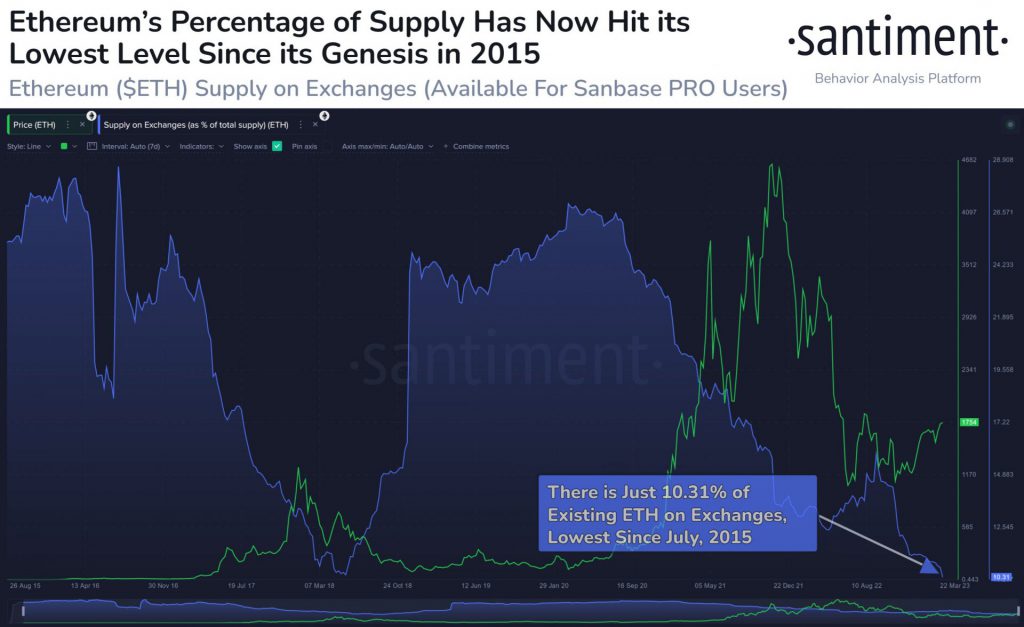
“Ethereum is now being held in self-custody and away from exchanges at the highest level since the week the token was introduced nearly 8 years ago. This essential all-time low ratio of $ETH on exchanges (10.31%) indicates confidence from #hodlers.”
This sudden shift was due to an array of things. The failure of CEXs certainly took the front stage. The downfall of FTX caused chaos in the market. Ethereum holders and the rest of the community seemed skeptical about leaving their funds in exchanges. Therefore, more supply was moved out of exchanges into self-custody wallets.
Another reason for this decline was attributed to the network’s transition from proof-of-work [PoW] to proof-of-stake [PoS] through the Merge. While self-custody could be one of the reasons behind this decline in supply on exchanges, there was another explanation as well.
Staking has become integral in the latest version of the Ethereum network. April will see the release of Shanghai, the next Ethereum upgrade. Stakeholders and validators will be able to remove their holdings from the Beacon Chain during the Shanghai hard fork. With all of this in place, Ethereum’s supply on exchanges is bound to spiral.
Can Ethereum reclaim $1.8K anytime soon?
At press time, Ethereum was trading for $1,729 with a 1.20% daily drop. Earlier today, the altcoin dipped to a low of $1,690.
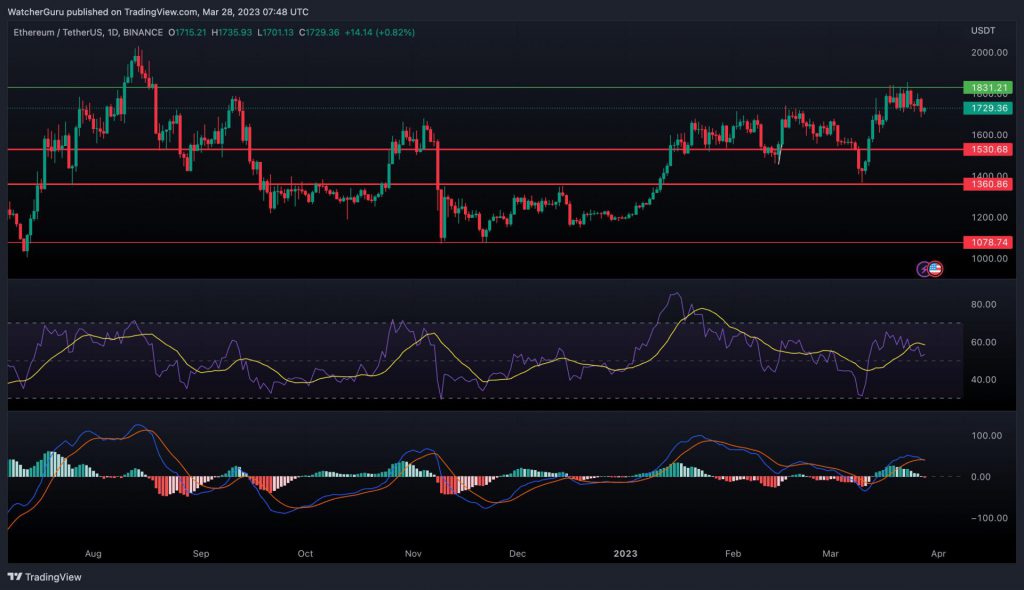
The daily chart of ETH was noting a shift from a bullish to a bearish realm. The Relative Strength Index [RSI] indicator noted that buyers were still in the ETH market. However, the RSI marker was inching closer to the 50 median. Anything below this level could indicate a rise in selling pressure.
The MACD indicator, however, was in a bearish crossover. The MACD line was dipping below the signal line after a long stay in the bullish arena. If this trend persists, the asset could seek support at $1,530.