


Ethereum is currently grappling with its daily 50-SMA (yellow) as bulls look to scale to $3,400. ETH could register a higher low above $2,900 if the current trend taps the upper limit of a weekly support zone.
At the time of writing, ETH traded at $3,247, up by 3.3% over the last 24 hours.
Ethereum Daily Chart
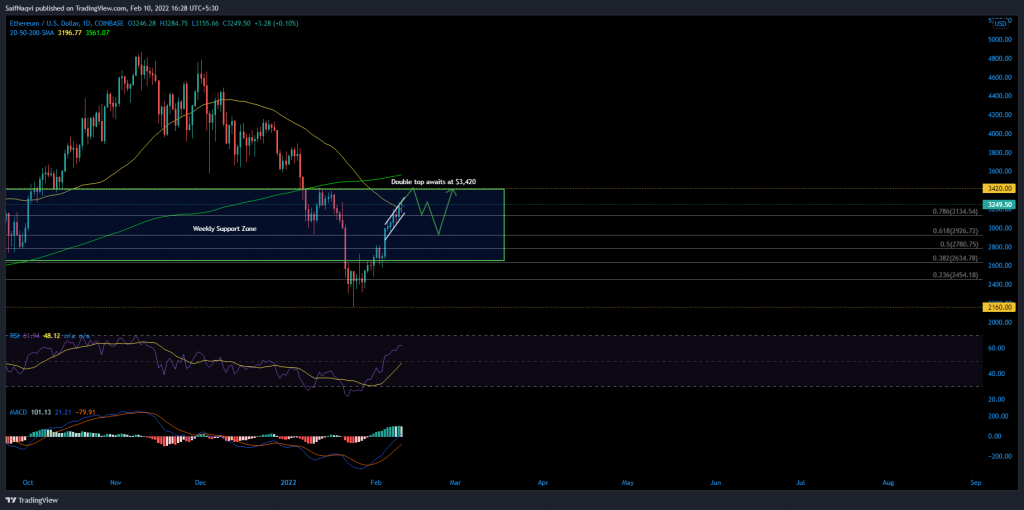
Ethereum’s rally was inching towards the upper limit of a weekly support zone between $3,400-$3,000. A successful advance above the daily 50-SMA (yellow) could see ETH register another 6% ascent as the price travels through a region of low sell-side pressure.
However, a double top pattern would come to light at $3,420, allowing short-term traders to cash out on a potential 60% bull run from 22 January’s low of $2,140. For the trend to chart a new higher low, the resulting correction would have to halt above the 38.2% Fibonacci level. Pushbacks offered at $2,920 or $3,134 could even align ETH right back up to $3,420. From there, bulls would look for an upwards breakout.
Meanwhile, bears would be in charge if ETH slips below its daily 20-SMA (red). Should the 23.6% Fibonacci level fail to cushion losses, expect ETH to retest $2,160 and eye a bullish rebound.
Indicators
The daily RSI was just still 15 index points away from the overbought zone, meaning that ETH could stretch above the 50-SMA (yellow) before the anticipated correction. Until then, its current reading could generate more longs.
Furthermore, the daily RSI poked above equilibrium for the first time since late November, outlying the active bullish force in the market. The Signal line (orange) visibly had a bit of distance to cover before a bearish crossover.
Conclusion
The bullish reading on the MACD and RSI support Ethereum on its march towards $3,420. However, a double top at the highest point of a weekly supply zone could put ETH in danger of a major correction as investors lock in their gains.