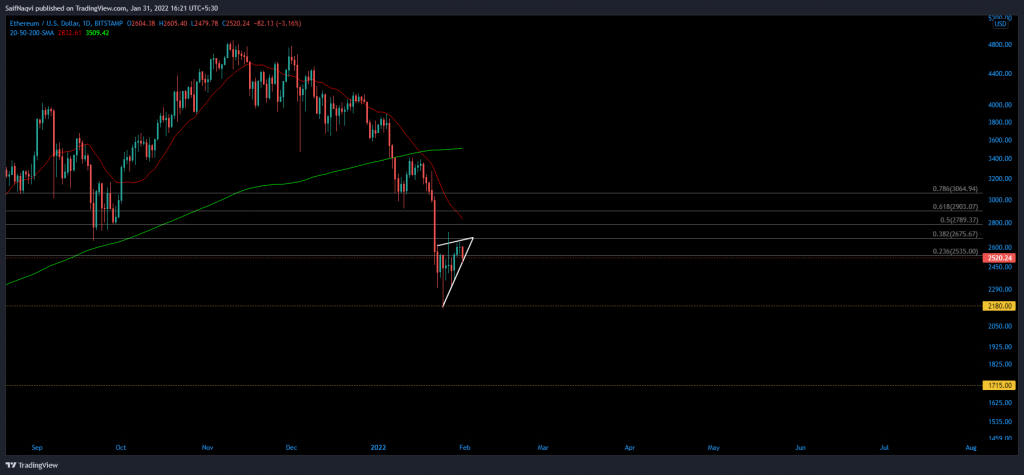
Ethereum’s daily chart pictured limited upside and potential for sharp losses this week. A lot would be determined whether the price can push above its daily 20-SMA (red) and target a comeback to sub $3,500. At the time of writing, ETH traded at $2,566, down by 2.8% over the last 24 hours.
Ethereum Daily Chart


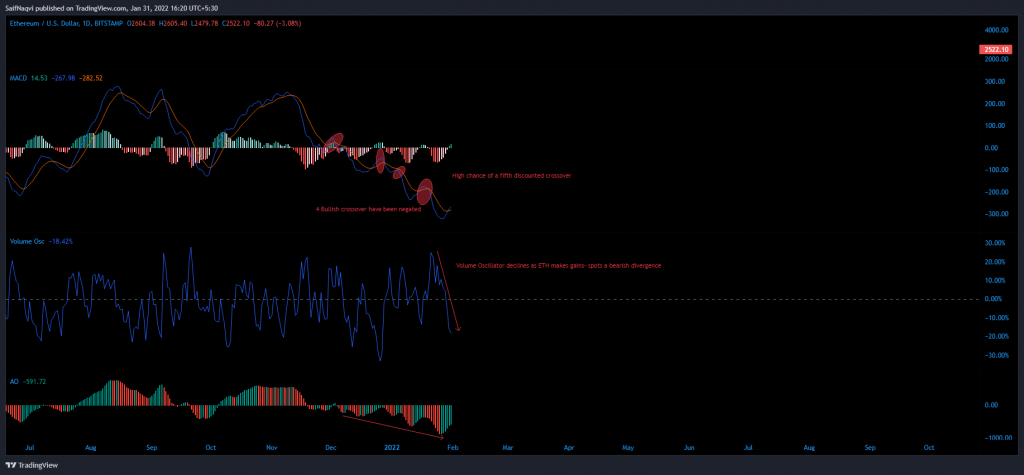
Ethereum inched upwards within a rising set up last week after forming a near-6 month low on 22 January. Its short period of relief was expected to come to a flat end before the benchmark 61.8% Fibonacci level is flipped to support. This was since a large number of bulls were absent when ETH made a 22% from $2,160 to $2,650. The volume oscillator slipped below its half-line on 28 January, denoting receding buy volumes as ETH’s wedge moved upwards (not shown).
Instead, momentum could get behind the resulting breakdown from the pattern. If losses extend below 24 January’s swing low of $2,160, ETH would likely stretch to a demand zone between $1,800-$1,720.
To negate such an outlook, ETH needed to advance above its daily 20-SMA (red). The resulting breakout would prompt other bulls to get in on the action and help ETH combat sellers at the 78.6% Fibonacci level. In either case, an extended recovery would likely be capped at the daily 200-SMA (green) around $3,500.
Indicators


Sellers have been reluctant to give up their firm grip on ETH’s market. The MACD’s last five bullish crossovers were negated almost instantly and a potential sixth could be discounted as well.
Meanwhile, higher peaks on the Awesome Oscillator were another undesired reading for optimistic traders. No bullish divergences or twin peaks were spotted at the time of writing.
Conclusion
Ethereum’s daily indicators did not look very promising. Hence, its rising wedge was unlikely to progress above the daily 20-SMA (red). ETH was vulnerable to a breakdown from the pattern and losses could extend to $1,7020 in a worst-case outcome.


