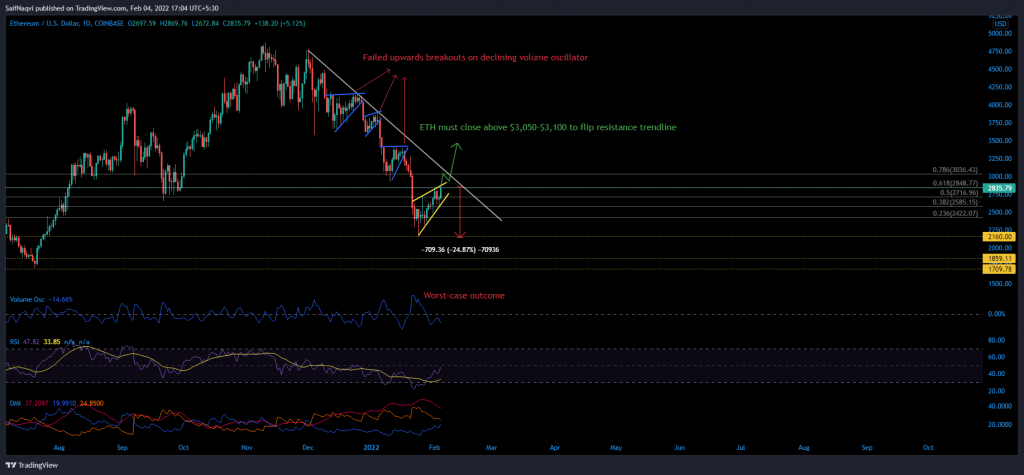
Ethereum was vulnerable to a bloodbath if its price does not hold above $2,850 during the weekend. The resulting correction could drag ETH’s value by 24% if no immediate throwbacks are observed. At the time of writing, ETH traded at $2,838, up by 9.4% over the last 24 hours.
Ethereum 4-hour Time Frame


Ethereum’s price was trading at the upper trendline of its rising wedge- a region which also clashed with the 61.8% Fibonacci level (calculated from ETH’s decline from $3,271 to $2,158). At first glance, an upwards breakout was certainly on the table. A move above the immediate resistance area could force a move back to sub $3,200. However, the Volume Oscillator (VO) suggested otherwise through some interesting observations.
For instance, the Volume Oscillator has constantly declined as ETH’s wedge developed over the past couple of weeks. A quick recap of ETH’s price action during late December showed that three wedges failed to trigger an upswing due to a weakening VO.
Should history repeat itself, ETH would break south from its wedge and find momentary relief at the 23.6% and 38.2% Fibonacci levels. In case ETH slips below $2,160 next week, an area of demand between $1,860-$1,700 would likely be its next destination. Overall, the move from ETH’s current level to $1,
Indicators
The daily RSI was challenging the mid-line, which meant that there was downside potential should bears reject a move above 50.
However, a bullish crossover on the Directional Movement Index would likely call for an upwards breakout and negate the pessimistic outlook. In either case, ETH would have to overcome a resistance trendline at its next point of contact at $3,150 to shrug past a larger downtrend.
Conclusion
Bears were expected to reject Ethereum above $2,850 and force a correction. If near-term supports at the 38.2% and 23.6% Fibonacci fail to contain losses, ETH would retest its 24 January swing low of $2,158.


