

Is it a bull? Is it a bear? The Ethereum price chart is currently at a crucial level that could determine its short-term future. The leader of altcoins recently witnessed its value collapse within a descending channel. The drop was 7%, from $1,249 to $1,160 on 27th June, as shown in the ETH/USD chart below.
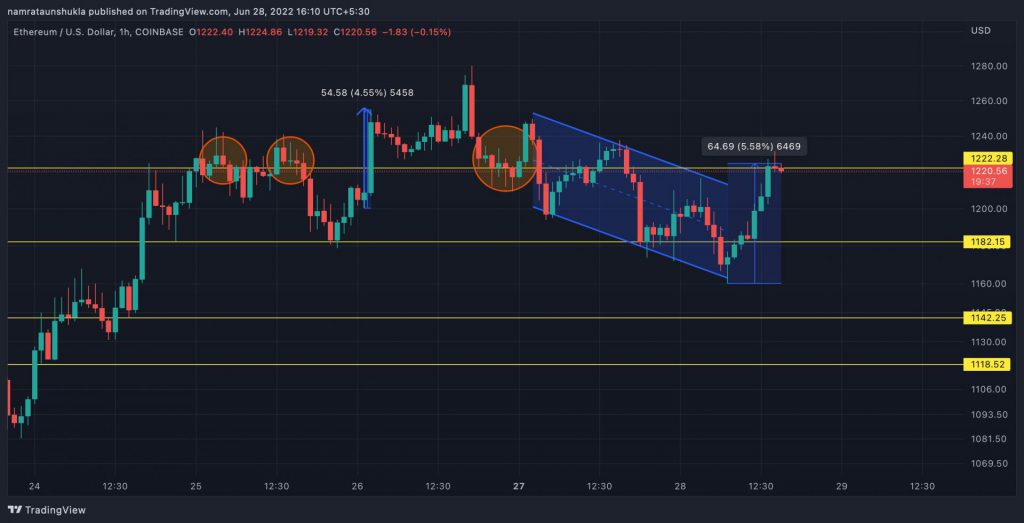
However, the price broke out of the bearish pattern shortly after, and buying pressure pushed the ETH’s value by 6.55% on 28th June. This buying pressure could not be sustained as the price had started to move between the immediate resistance at $1,236 and support at $1,220.
The above chart highlighted the crucial role played by the $1,220 support previously for Ethereum. The orange circles mark the points during which the price of Ether failed to maintain this support and slipped to $1,214. The current price level was also witnessing a rise in the selling pressure. If the selling of Ethereum continues, it may drop under $1,214 and could halt only at $1,182, where lies the following support.
According to reports, this buying pressure was visible on cryptocurrency exchange Binance among other centralized exchanges. An anonymous whale or prominent investor was speculated to be behind the sudden pump of the value of Ethereum.
Ethereum Gas reaches a low point
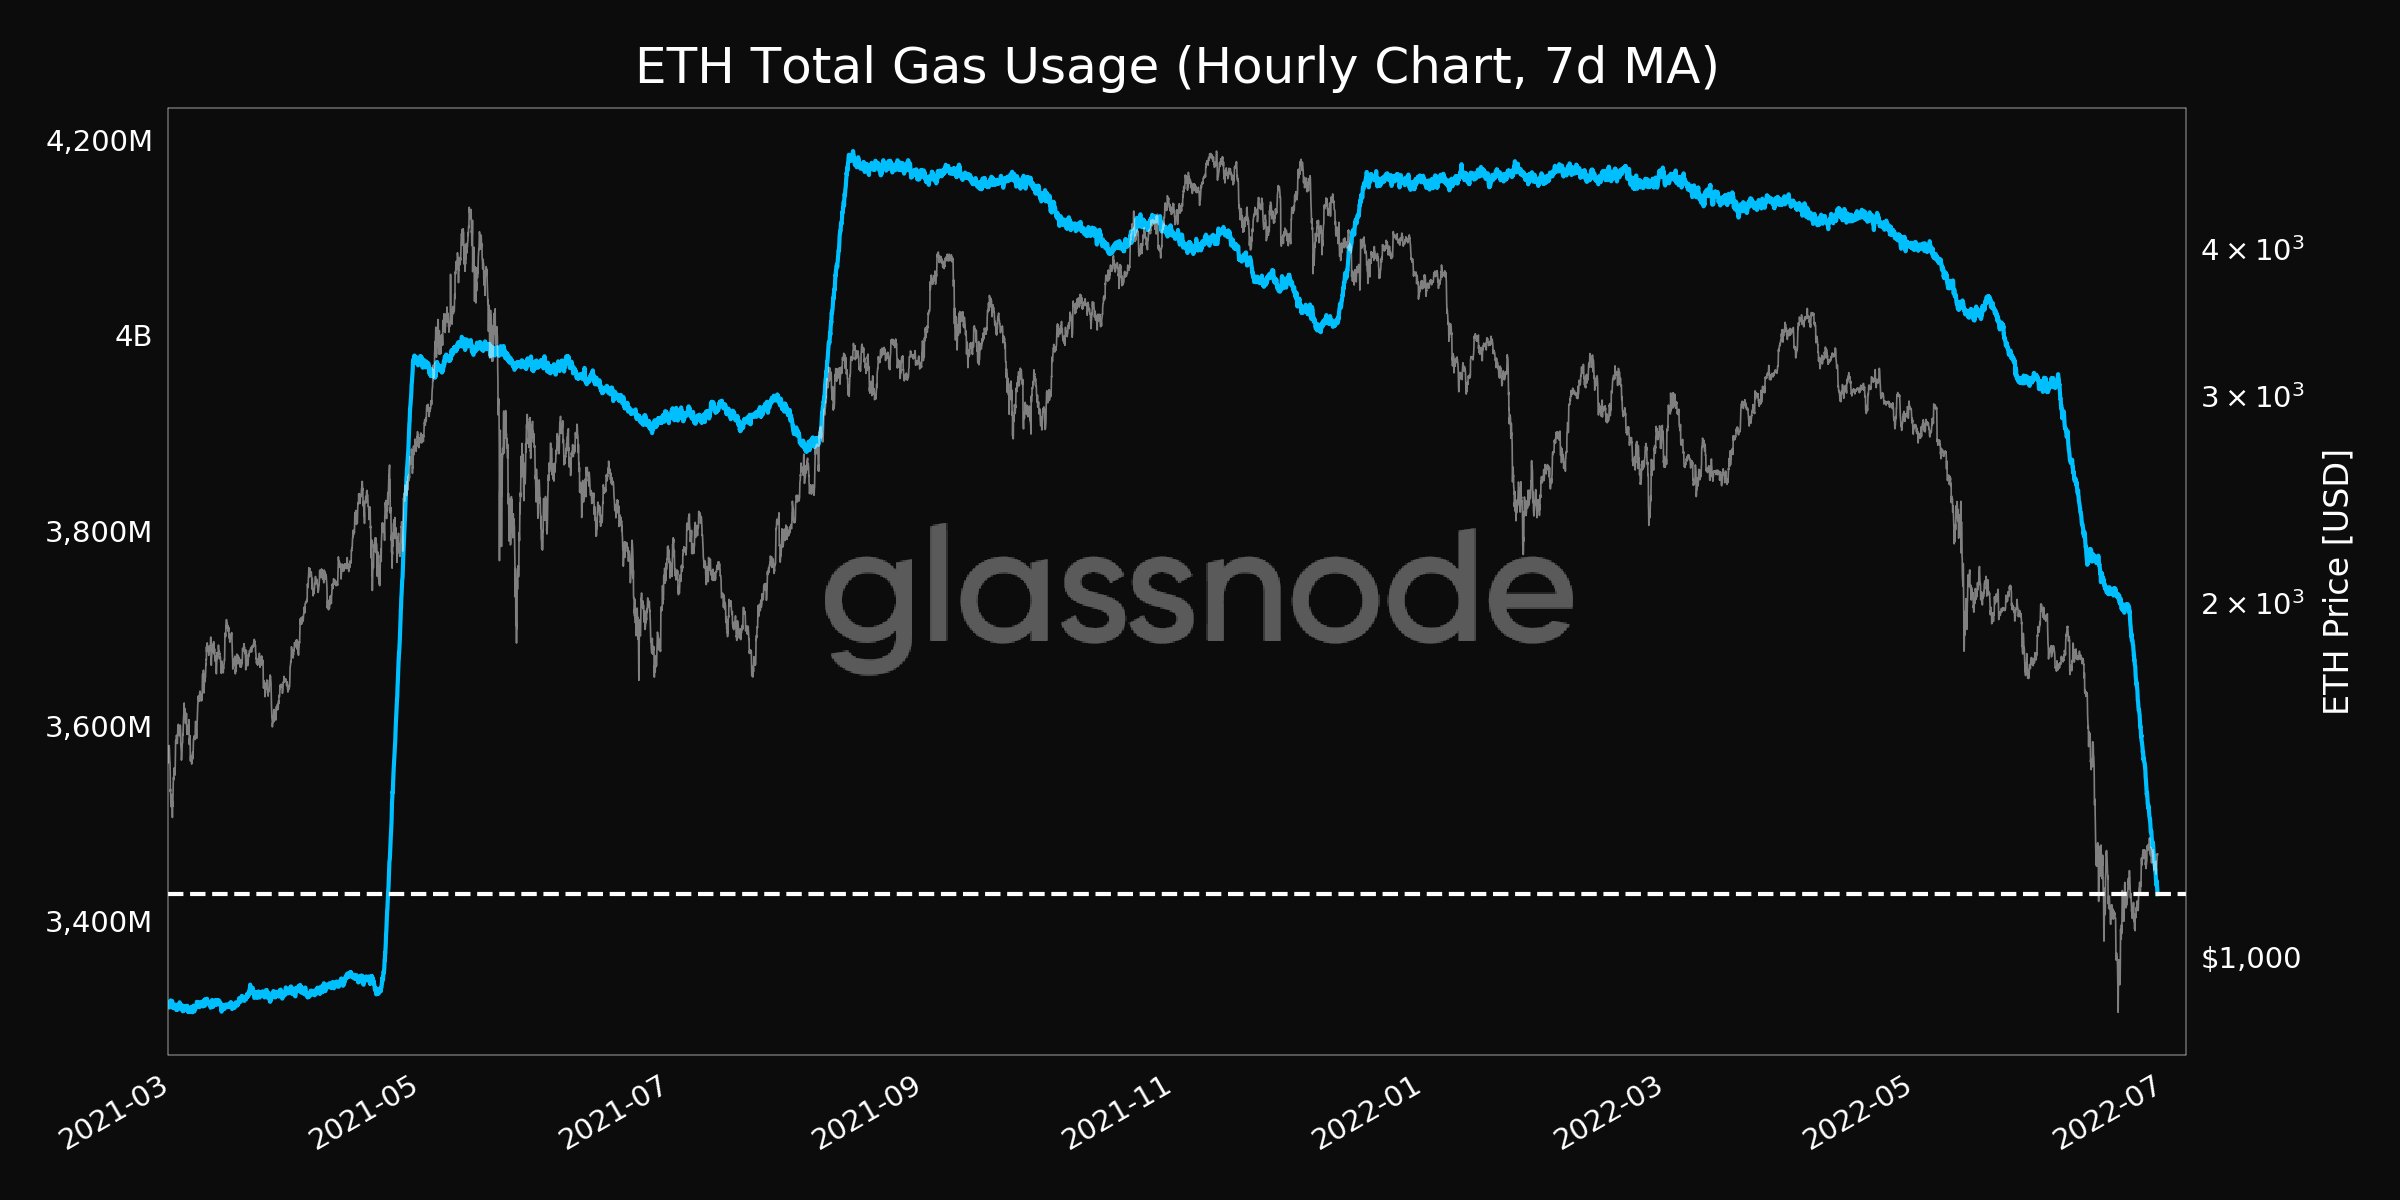
This bear market has been rough for Ethereum and the rest of the market. As the bears stepped in, the digital asset’s value collapsed to a low of $1,030- 75% off the $4,808 all-time-high. With tightening monetary policy and a falling cryptocurrency market, the Ethereum ecosystem witnessed a perfect storm leading to a historical de-leveraging event, per glassnode.
The signs of the decentralized market losing ground were visible by mid-June and escalated towards the end of the month. This was visible in the average gas price, reaching a 14-month low of 3,427,691,654.095, as per glassnode alerts.