


The global crypto market cap managed to re-claim the $800 billion threshold beginning of 2023. Top assets like Ethereum, on the other hand, have also started posing mild recoveries. The largest Altcoin is trading at $1.2k at press time, which is up by 1.5% over the past 24 hours.
Weary Network Activity Raining On ETH’s Parade?
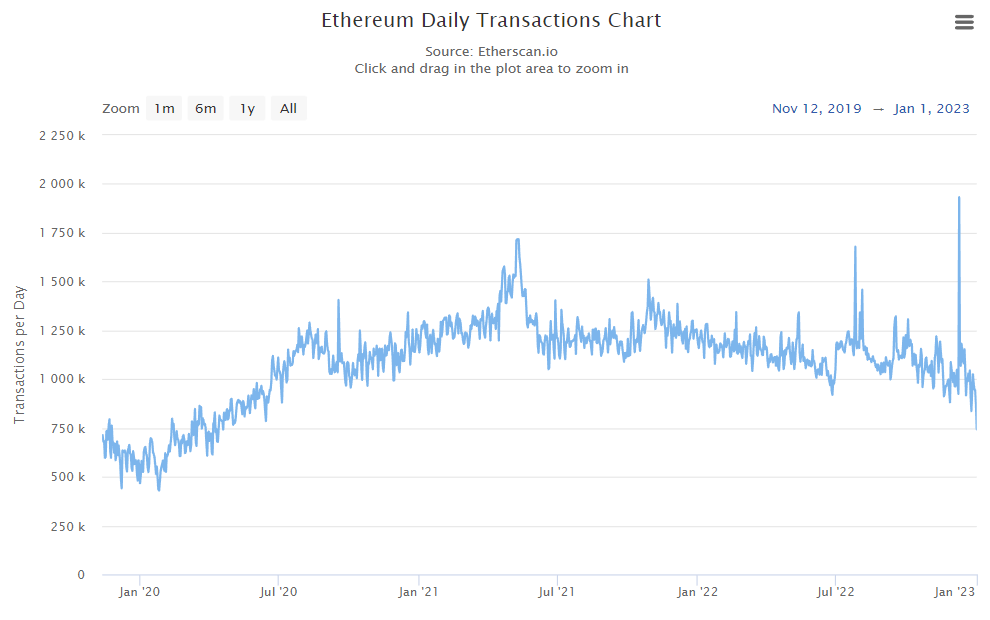
However, the state of Ethereum’s network activity is underwhelming at the moment. The transactions on the mainnet are down to 2020 levels. As shown below, the reading of the said metric dropped down to 742k on New Year.
Despite the slight recovery noted over the past day, the number continues to hover around its lows.
Also Read: Not Ethereum, Binance’s BNB Chain Is The ‘Largest’ L1 Blockchain in 2022
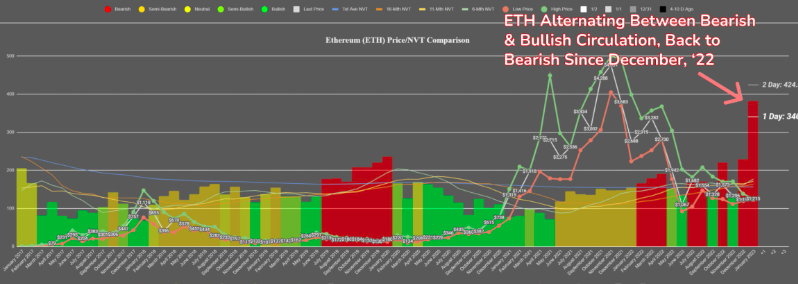
Alongside, according to Santiment’s price prediction model based on network activity, Ethereum still requires “some increased network utility” to justify its current market cap.
Simplistically, red and orange colors mean the market is looking bearish based on token circulation. Yellow-green and green colors mean the market is looking bullish. As shown below, Ethereum reverted back to bearish territory in December 2022.
Thus, Santiment highlighted that the circulation rate of the network needs to pick up in 2023. It also noted that this week will be “telling” as it marks the beginning of the non-holiday season.
Also Read: Bitcoin, Ethereum, XRP, Cardano: Which Crypto Ranks No.1 in 2022?
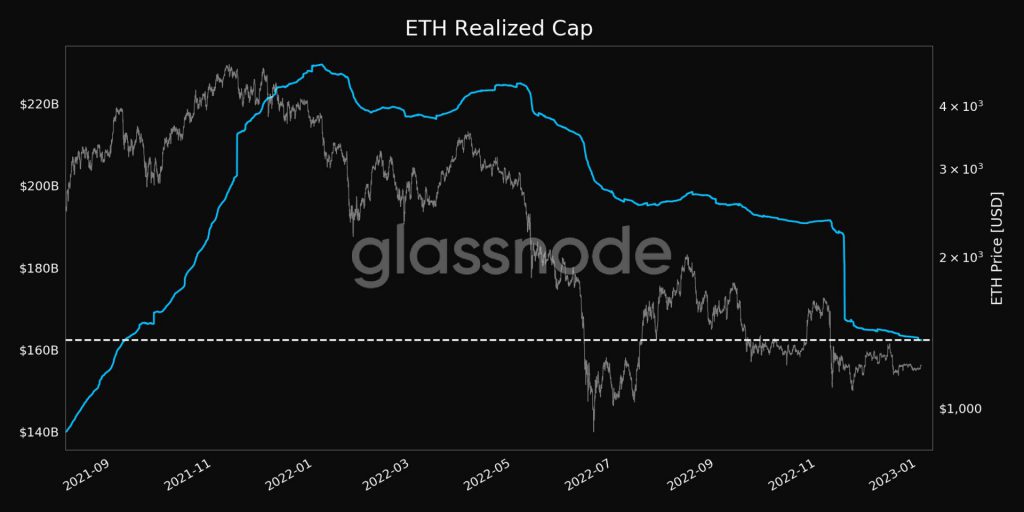
Parallelly, it seems like holders are giving up. The realized cap has dropped to a 15-month low. The same indicates that ETH bought at the top of the bull market is being spent now, around the bottom of the bear market. This is not an encouraging sign because it points towards eroding conviction.
As a result, it’d be imperative for the aforementioned metrics to improve in the coming days for ETH to organically bounce back.