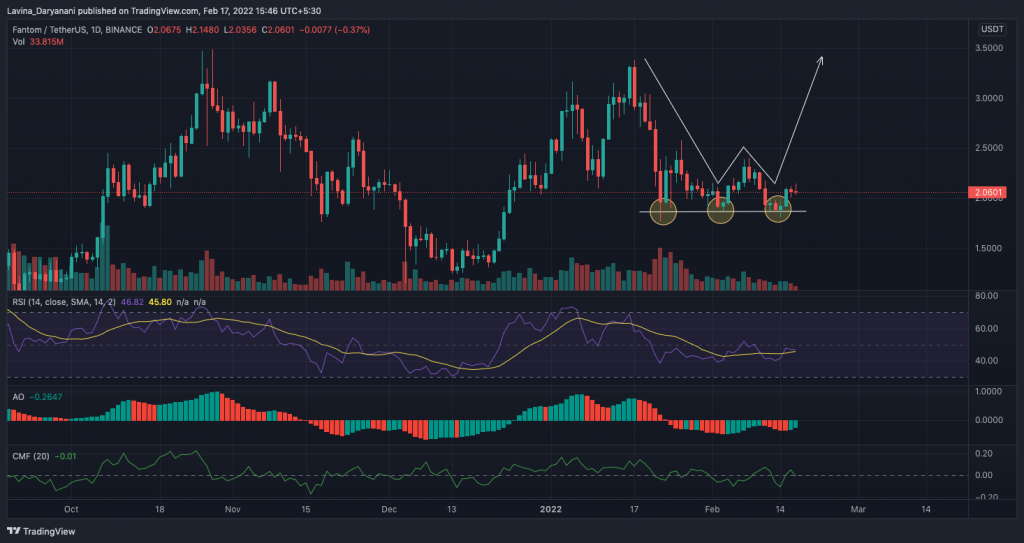
Fantom [FTM], along with most other top alts in the market, was seen bearing the brunt of the broader market slump on Thursday. Despite its weekly 8.5% dip, Fantom was at quite an interesting juncture at the time of press.
Since the end of January, FTM has visited the $1.86 level thrice. Consequentially, this has formed a triple bottom pattern on its chart. As such, the said setup is bullish and is usually followed by a breakout above the horizontal trendline.


Are all the boxes checked?
At this stage, not really. Even though Fantom has started trading well above the $1.86 level, bulls have not been able to assert pressure. After registering quite a long green candle on Tuesday, the bullish momentum started weakening in the Fantom market. The last two candles have been bearish.
Even the indicators hardly projected any optimistic takeaways. The Relative Strength Index [RSI] was seen heading towards 40 at the time of press despite noting an incline earlier in the week. The RSI was also on the verge of dipping below its moving average, conveying another sign of weakness.
Even the Awesome Oscillator was seen holding ground in its bearish territory while the Chaikin Money Flow too had just stepped into the bearish region at the time of press.
Data from ITB further confirmed the bearish bias present in the market. Right from the 1-minute window to the 6 hour one, the number of sell trades had exceeded the buy trades. The same can be evidenced from the snapshot attached below.


Thus, for the w-shaped recovery to materialize, bulls must step up. If they fail to assist Fantom over the next few trading sessions, then it wouldn’t take much time for the bullish triple-bottom set up on the chart to invalidate itself.


