


A symmetrical triangle breakout has put Fantom in a good position to register another 19% jump in value. Aggressive buy entries can be placed between $1.47-$1.44, while those with a lesser risk appetite must wait until the 200-SMA (green) is toppled. At the time of writing, FTM traded at $1.54, up by 8.8% over the last 24 hours.
Fantom 4-hour Chart
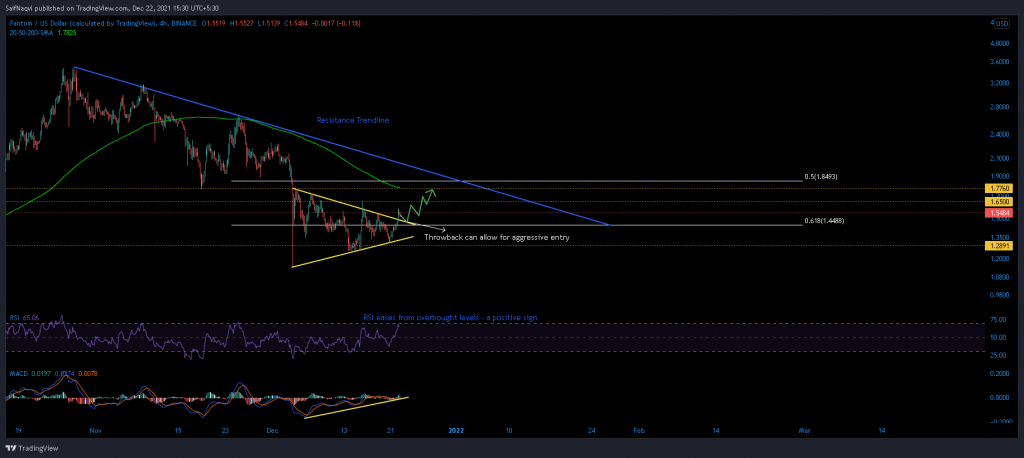
A series of lower highs and higher lows set up a symmetrical triangle on Fantom 4-hour chart. The pattern carries the potential for a breakout in either direction, although bulls have set the precedent in their favor following a break above the upper trendline. Moving forward, a throwback to the 61.8% Fibonacci level can allow for aggressive buy entries. A throwback can be defined as a retracement back to the breakout point once a resistance area is toppled. Once short-term traders lock in gains and exit the market, renewed buying pressure usually pumps the price again.
In this case, a throwback to $1.44 can result in a possible 23% surge, provided buy volumes remain consistent as FTM tackles swing highs at $1.65 and $1.77. Any further price progression can be denied by the 200-SMA (green) and an upper sloping resistance line. To invalidate this thesis, bears need to target a close below 20 December’s swing low of $1.31. This would open up FTM for a breakout in the opposite direction.
Indicators
The 4-hour RSI was amidst a downtick after touching overbought levels. However, a bullish reading above 55 would continue to drive further growth for FTM. Similarly, higher lows on the MACD were certainly a positive sign. Should this index continue to trade above its bottom trendline, more gains can be anticipated in the coming days.
Conclusion
Observers can cash in on Fantom’s breakout once a throwback takes place between $1.44-$1.47. Take-profits can be set at $1.776, allowing for a 19% gain. However, such an entry carries a large element of risk as FTM currently traded below its 200-SMA (green) and was susceptible to short-selling. A safer buy trade can be placed once FTM clears this long-term moving average and an upper sloping resistance line (blue).