Periodic sell-offs in the broader market have had a damaging effect on Floki Inu’s price trajectory. As a result, its monthly ROI sits at a negative 62%, the highest amongst its meme coin counterparts BabyDoge, Dogecoin, Shiba Inu, and Dogelon Mars. However, bulls were in with a small window of opportunity to flip FLOKI’s fortunes through a symmetrical triangle breakout. At the time of writing, FLOKI traded at $0.00003600, up by 8% over the last 24 hours.
Floki Inu Hourly Time Frame


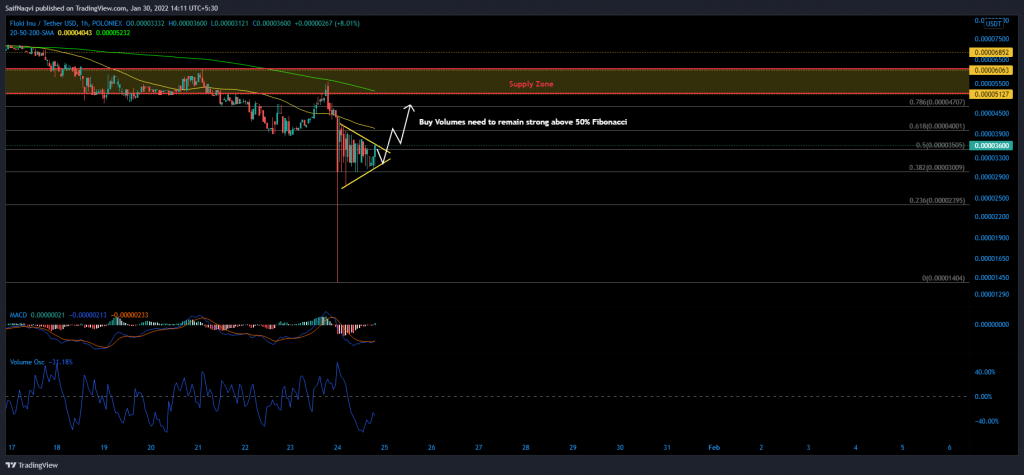
A massive dump on 24 January saw a single candlewick extend as low as $0.00001404. The Fibonacci tool was applied on this decline to identify potential areas of support and resistance.
A quick look at the 4-hour chart showed that bulls were attempting recovery at the 38.2% Fibonacci level. The resulting higher lows plotted a symmetrical triangle and a buy signal on the MACD presented chances of an upwards breakout.
A decisive close above the 50% Fibonacci level can trigger an additional 10% jump but getting past the 50-SMA (yellow) at the 61.8% Fibonacci would require greater buy volumes. The volume oscillator was starting to pick up steam below its half-line but bulls were yet to fully back FLOKI’s breakout.
Should FLOKI fall short of the abovementioned target, momentum would swiftly shift over to the sellers who have been the more dominant force in the market. Once the 38.2% Fibonacci level is overcome, sellers can inflict more pain at the 23.6% Fibonacci support through a 22% sell-off.
Conclusion
Bulls were finally gaining some market control but bears were hot on their heels. Hence, it’s important for FLOKI to close above the 50% Fibonacci level over the next 24 hours. An upwards breakout could trigger a much-needed recovery should bulls consolidate above the 50-SMA (yellow). If not, expect FLOKI to fall at the behest of sellers once again.


