


The collapse of FTX took a toll on several firms as well as assets across the market. But the most impacted token had to be the exchange’s native token FTT. The price of FTT dipped to an all-time low of $0.8245 on Jan. 1, 2023. Ever since November 2022, this token has continued to ride the bearish wave. However, in a new turn of events, the troubled token was seen pocketing triple-digit gains.
Earlier today, the FTX token surged from a low of $1.32 all the way to a high of $2.74. This was possible due to the 106% surge that the asset registered over the last couple of hours. However, at press time, the altcoin was experiencing correction which pushed its price down to $2.29.
But why is FTT on an uptrend?
Is FTT making a comeback? Not quite yet. The token’s latest pump was attributed to the recovery of $7.3 billion in liquid assets from FTX. The possibility of the exchange reopening received attention which further instigated this upward trajectory.
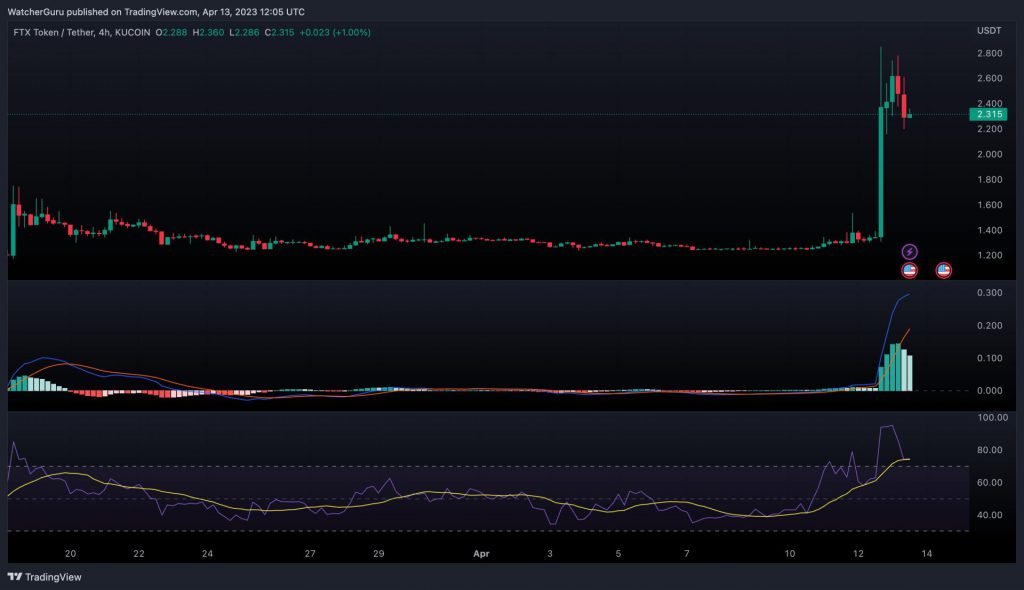
As seen in the chart, FTT witnessed close to zero movements over the last couple of days. However, the sudden upswing has brought a bullish notion into the FTT market. The MACD indicator formed a bullish crossover which suggested elevated chances of the persistence of this upswing. The Relative Strength Index [RSI] highlighted how FTT was being overbought by the community. While the pump was sowed by the aforementioned news, it went on to rise up due to the increased buying activity.
Can ARB make it to $2?
While the hype around Arbitrum and its airdrop lost steam, the native token of the network ARB clearly did not. At press time, the asset was trading for a high of $1.31 following a 12.26% daily rise. Similar to FTT things looked bright for ARB. The four-hour price chart of Arbitrum’s ARB revealed heightened buying activity.
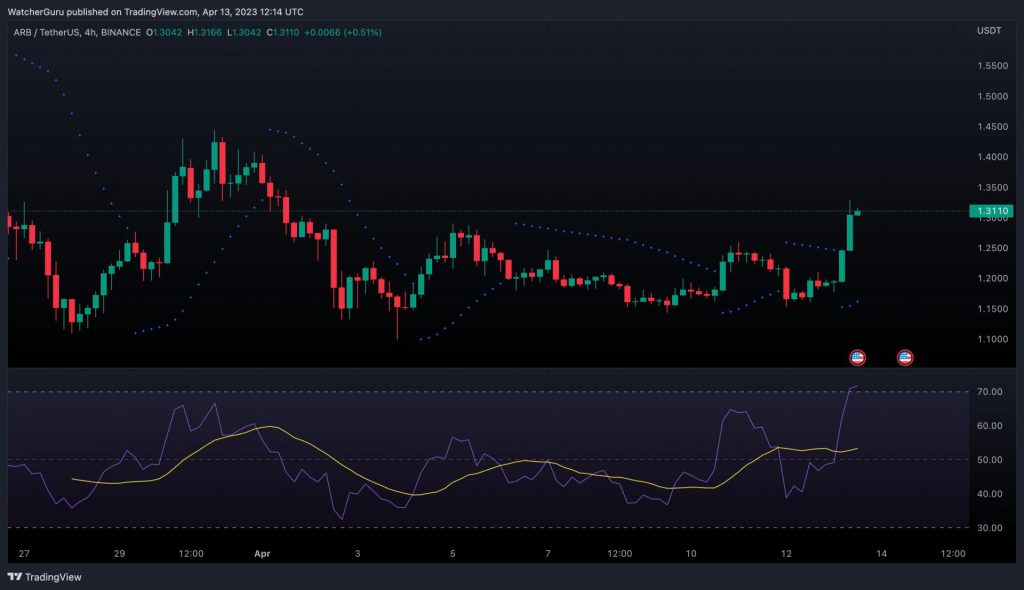
Looks like the ongoing momentum could last longer. The Parabolic SAR indicator formed dotted lines below the candlesticks acting as support against any possible downfalls. While both ARB and FTT are quite volatile, fluctuations during this period could lead to upswings.