


FTX, the second-largest crypto exchange and the largest crypto derivatives exchange in the United States has seen some big upgrades in the recent past. The company, founded by Sam Bankman-Fried, has some serious backing from some big names in the industry. In addition to that, the success of FTX has propelled him into the top 30, under 30 billionaires on the Forbes list. As of today, the 29-year-old MIT graduate is worth $22 billion. Can FTX push his billion-dollar net worth even higher? We dive into FTT technical analysis to find out.
FTT Technical Analysis
FTX was founded in 2017 and saw great demand from traders. This was mainly propelled by the famous VCs backing the project. Even now, three years on, FTX still attracts huge investors. In its latest VC funding round, companies like VanEck, Sequoia Capital, and Coinbase Ventures participated to raise $900 million.
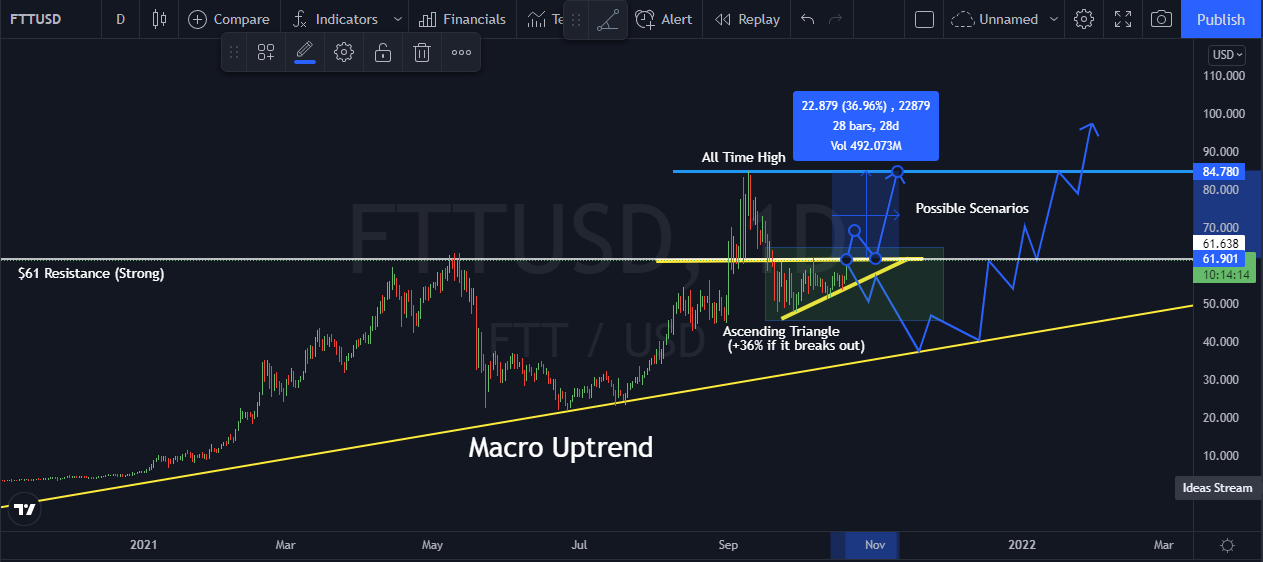
On a macro scale, FTT is currently on an uptrend. On December 17, 2020, FTT broke out of an almost three-year consolidation and began its ascent. The token topped at $63.21 before cooling down and dropping back to $22.62 around July 2021. Despite the massive 61% correction, FTT managed to score a higher low, further cementing the bullish narrative.
Since, July, FTT has pumped up to an ATH of $84.74 and is currently in a correction phase. Presently, the price of FTT is $60.88. The previous history predicts a clear trend which consists of a series of rallies and corrections. At $60.88, FTT is pushing an old resistance. On October 6, FTT tested this resistance but was rejected. This is the second test in the three weeks.
What are the Trading Indicators Saying?
On the daily timeframe, the Stochastic RSI is currently at level 80. Anything above 80 is in the overbought region and hence, is a bearish signal. If the $61 resistance level is strong enough, the Stochastic RSI could drop down from this point, forming a double top (M) pattern.
Another factor that feeds into the short-term bearish scenario is the current Bitcoin (BTC) rally. Bitcoin has received some good ETF news of late and is running on the back of that news. At the time of writing, the price of BTC is $64, 528. This is just 0.33% from its ATH price of $64,805. It is common knowledge that when Bitcoin starts rallying, altcoins bleed. Hence, this scenario might further contribute to FTT getting a bearish outlook in the short-term future. However, if FTT manages to break the $61 barrier, then all bets are off. We could see a 36% price burst that sets FTT back at its previous ATH price. This is highly likely because an ascending triangle has been forming in the 4H timeframe.
Final Thought
On-chain metrics show FTT is ready for another leg up. These metrics include Whale activity, Network activity. According to Santiment, the size of the FTT whale addresses shot up by 30% over the past three days. In addition to that, FTX has just burned $6.1 million worth of FTT tokens. This reduces supply and increases the value of the token. Betting on FTT to lose right now seems like a highly erroneous bet. Looks like Mr. Bankman-Fried is going to be getting a lot richer sooner rather than later.