


At $30,000, Bitcoin‘s price structure and direction remain unclear. While the macro-structure is bearish, the asset continues to hold its current price range. After testing a yearly low of $25,400 in the 1st week of May, BTC has managed to hold this range for four weeks. It also clocked in its 1st green candle, after 9-weeks of bearish momentum.
Now, a couple of signs are suggestive that Bitcoin might bounce back further. In this article, we will analyze the outlook for BTC over the next few weeks, and speculate if there is a further drawdown or recovery for the token.
Stablecoin Supply Ratio to rescue?
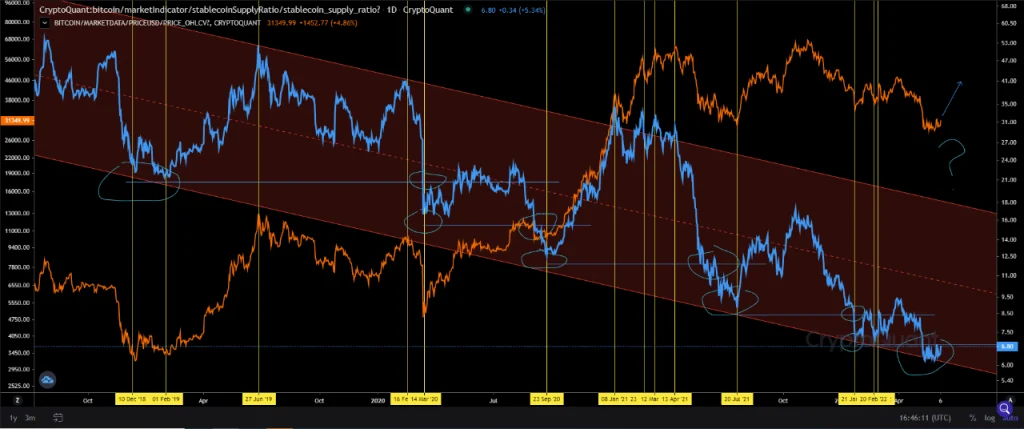
According to an analysis on CryptoQuant, the Stablecoin Supply Ratio or SSR is creating a downtrend. A dropping SSR value indicates higher Bitcoin buying power for stablecoins as more and more stable assets are kept on the side.
On observing the chart, historically SSR bottom(like in the current market) has led to some form of strong recovery, if not a complete trend reversal. With the market under extreme fear, many investors might look at the current market state as an opportunity. Keeping that in mind, some investors might have already played their hand.
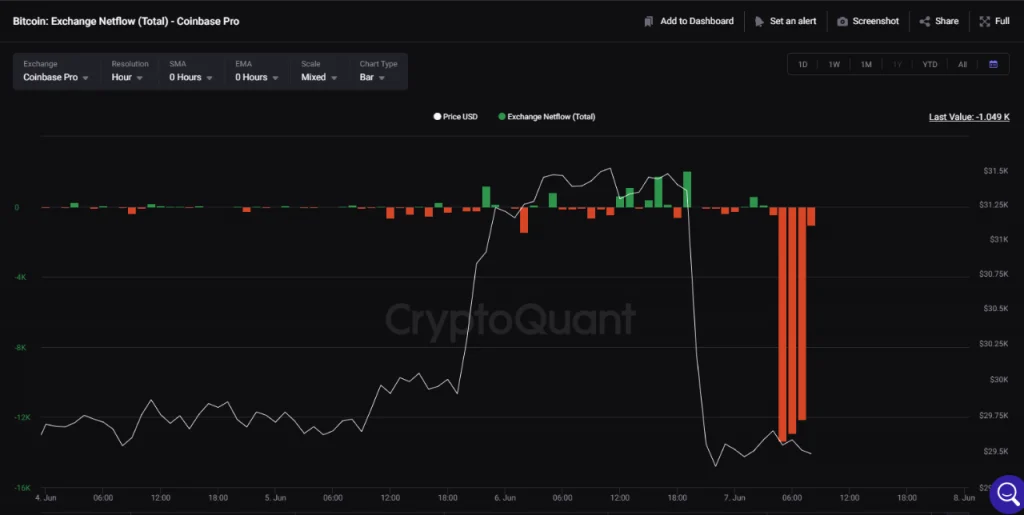
Data suggested that on Tuesday morning, over 38,000 BTC outflows were recorded from Coinbase. This is a positive development in terms of BTC supply decreasing from circulation. It is also important to note that Coinbase strongly caters to institutional buyers hence these outflows could be mostly triggered by long-term holders.
Is another Bitcoin Capitulation in the books?
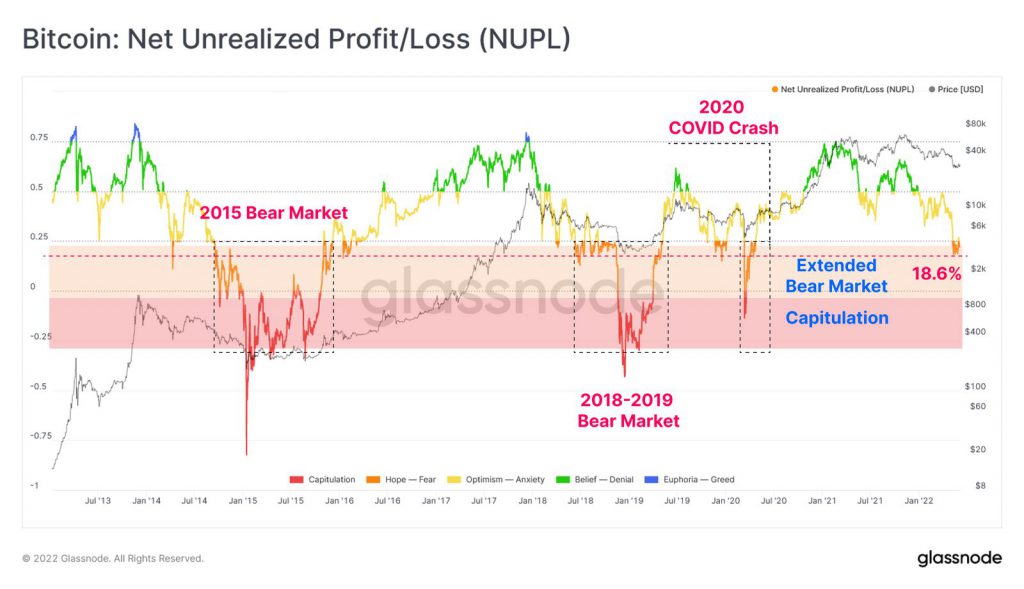
While the above signs are positive, one alarming situation taking place is the possibility of capitulation based on historical NUPL data. NUPL or Net Unrealized Profit/Loss measures the overall unrealized profit and loss of the network.
According to the above chart, NUPL has fluctuated between 18.6% to 25% since early May, indicating that less than 25% of the market cap is held in profit. Now based on past performance, Bitcoin has faced a period of capitulation mostly from this point, which has led to strong corrections. Now with the current realized price at $23,600, a full-scale capitulation might lead Bitcoin down to the $20,500 range before an actual recovery trend surfaces.
So BTC, which way?
While Bitcoin’s market might seem balanced in terms of trend direction, it is most likely that BTC drops further down to $20,000, strictly based on historical preference. The weekly price structure is still extremely weak for Bitcoin and buying pressure has not been strong enough in the past month. Hence, it is likely that the digital asset would fall further before heading up again.