

With Bitcoin mostly trading above $23k over the past few days, it seemed like the market was finally on its recovery path. However, when the asset’s daily chart is viewed, it can be noted that the king-coin has registered six back-to-back red candles. In fact, over the past 24 hours, the market’s largest crypto had shed almost 3% of its value, and at press time, it was seen trading around $22.8k.
Will Bitcoin’s bearish bells start ringing louder?
To analyze in which direction to expect the market to move in the coming days, let’s look into the state of a few key metrics.
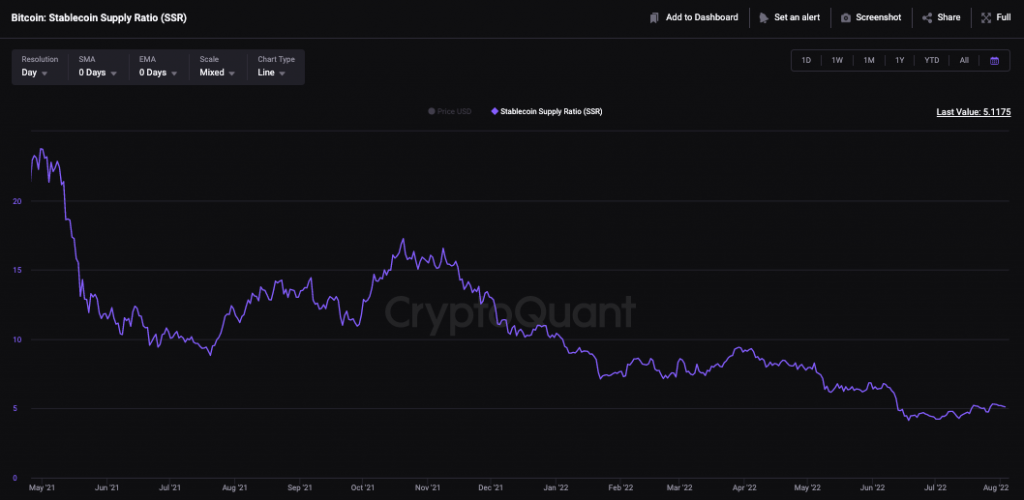
Stablecoin Supply Ratio [SSR]
In mid-June, Bitcoin’s Stablecoin Supply Ratio [SSR] was seen hovering around 4.1. Over the past few weeks, however, the same has inclined. At press time, the SSR reflected a value of 5.1, indicating a comparatively low stablecoin supply. The same essentially points out to the textbook theory of sell pressure gaining steam and warns of a possible price dip.
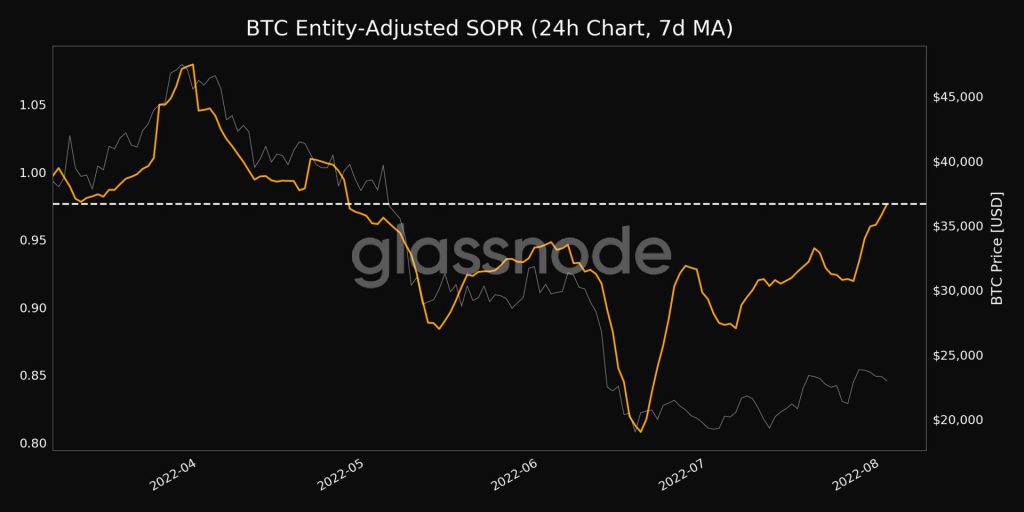
Spent Output Profit Ratio [SOPR]
Bitcoin’s entity-adjusted Spent Output Profit Ratio [SOPR] reached a 3-month high on Thursday and was seen inching towards 1. This means that coins that were being moved in losses are now almost on the verge of being sold in profit. At first glance, an uptrend might seem to be positive. However, it shouldn’t be forgotten that the SOPR trending higher connotes to illiquid supply being returned to liquid circulation, and the same is yet another red flag.
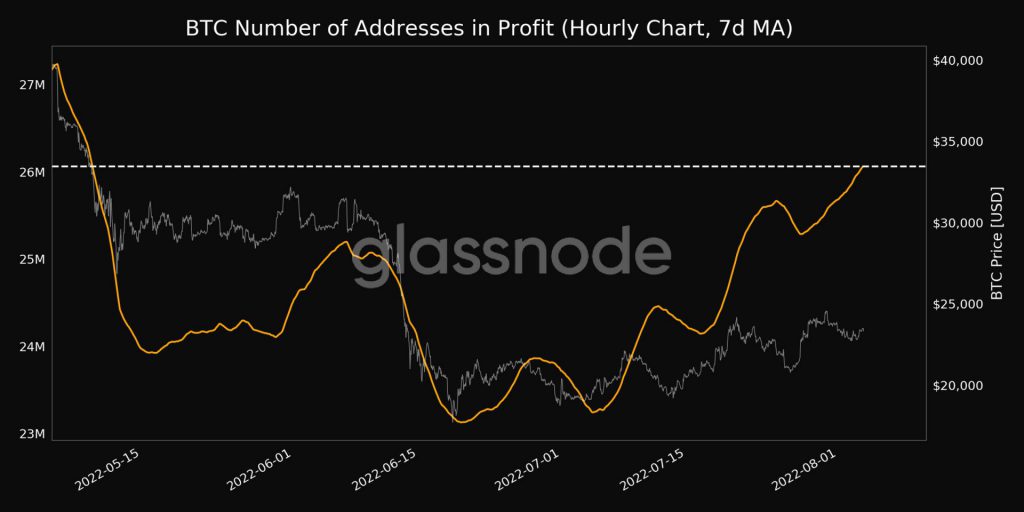
Profitable Addresses
Alongside, it is interesting to note that the number of Bitcoin addresses in profit has claimed a new 1-month high. At press time, over 26.06 million addresses had unrealized gains, implying that they’d be triggered to sell their coins to relish their yields. The same, again, supports the bearish extension narrative.
Conclusion
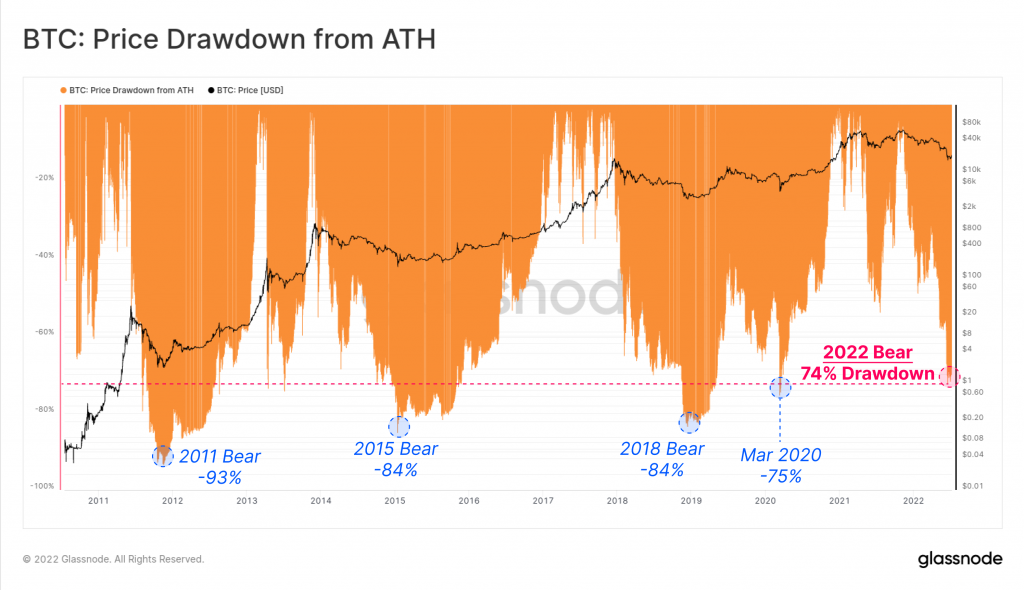
The scale and magnitude of the impact of the ongoing sluggish phase seem to be quite deep. However, the current bear market is the least severe in history, from the perspective of price drawdown from ATH. With time, Bitcoin bear markets have bottomed out at less severe drawdowns each cycle.
As depicted below, from 2011’s 93%, the number had shrunk to 75% by 2020. At the moment, we’re approximately 74% down, and if the same tradition were to adhere to this time as well, it’d be pertinent for Bitcoin to pose an immediate recovery.
However, keeping in mind the bearish signs highlighted above, it doesn’t seem like the market’s downtrend phase has come to an end. So, in light of the same, it can be contended that Bitcoin is primed to extend its bearish leg. Resultantly, any relief rally that we note in the days to come, will likely be a bear trap.