


JPMorgan just unveiled a stock forecast model that’s making waves across Wall Street. The banking giant’s new approach to stock market prediction tools has uncovered somethin shocking about how markets actually work. Their AI stock market forecasting system analyzes six different market signals, and the findings are challenging pretty much everything we thought we knew about market volatility signals and investor risk management.
Also Read: Senate Passes GENIUS Act as JPMorgan Meets SEC on Onchain Markets
Inside JPMorgan’s AI Stock Forecast Model And Market Volatility Impact

The Six-Signal Framework That’s Changing Everything
So here’s how JPMorgan’s stock forecast model actually works. Strategists at the bank, led by Nikolaos Panigirtzoglou, built this system that looks at six key signals: volume, value, positioning, flows, economic momentum, and also price momentum. Each of these gets measured against its own historical performance using what they call z-scores.
The team trained their model on data going back to late 2022, and then they tested it on more recent numbers. What they found was pretty impressive – their six-month predictions for down moves were correct 76% of the time during training periods. Even the “out of sample” testing achieved 63% accuracy, which is way better than most competing stock market prediction tools out there.
The Shocking Discovery About Valuations
Now here’s where things get really interesting with JPMorgan’s stock forecast model. You know how everyone always says that cheap stocks are good investments? Well, this ai stock market forecasting research is saying the opposite.
The strategists found something that goes against conventional wisdom. According to their analysis, when valuations look attractive, future returns tend to disappoint. This happens because good valuations often get tied up with declining 10-year Treasury yields, which could signal trouble for economic growth down the road.
Economic Momentum and Market Positioning
The JPMorgan model shows that stronger economic momentum – measured through global manufacturing data – and higher trading activity both increase the chances of market gains. But here’s the catch: when there are high levels of bullish positions, or large flows into stock funds versus bonds, that’s actually a warning sign.
These market volatility signals suggest overcrowding, which typically leads to corrections. It’s like when everyone’s piling into the same trade – that’s usually when things start getting risky for investor risk management strategies.
What the Model Says Right Now
At the time of writing, JPMorgan’s stock forecast model is delivering some pretty optimistic news. The system shows a 96% probability that stocks will rise over the next six months. That’s one of the highest confidence levels we’ve seen from these kinds of stock market prediction tools.
This bullish reading comes as US stock futures have been rising, putting new S&P 500 records within reach. The AI stock market forecasting model’s current assessment suggests that positioning levels and market conditions support this positive outlook.
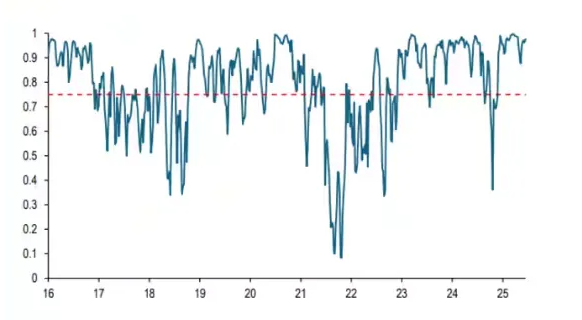
J.P. Morgan Flows & Liquidity
What This Means for Investors
This research from JPMorgan is really changing how we should think about traditional market indicators. The fact that good valuations might actually signal future problems means investors need to rethink their approach to finding bargains.
Also Read: Amazon: Analysts Reveal What Could Send AMZN Surging Higher
The model’s focus on market volatility signals and positioning data provides valuable insights into when markets might be getting too crowded. For investor risk management purposes, the findings suggest that when institutional money flows heavily favor stocks over bonds, that’s when correction risks start building up.
Right now, the 96% bullish signal from JPMorgan’s stock forecast model is certainly encouraging. But given how accurate these stock market prediction tools have been at predicting downturns, investors should definitely pay attention when the model eventually turns bearish.