


Litecoin has looked weak since a massive decline of 53% took place between 10 November to 4 December 2021. Based on the bearish nature of its EMA Ribbons and a troublesome downtrend along the OBV, forming an optimistic outlook for LTC was rather difficult. However, its price was expected to disregard any additional sell-offs as long as it held above a crucial support line. At the time of writing, LTC traded at $150, up by a marginal 0.4% over the last 24 hours.
Litecoin 4-hour time frame
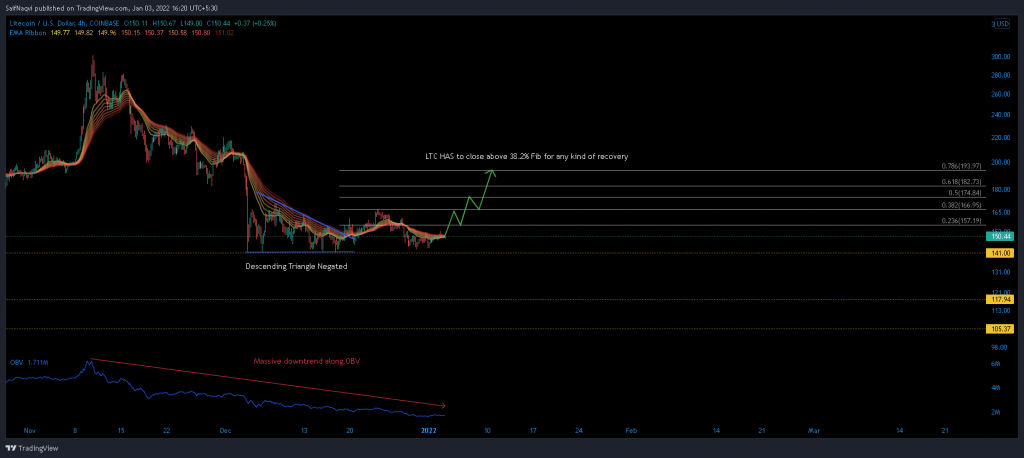
Litecoin’s late-November bull run came to an abrupt end on 10 November after Bitcoin failed to advance above $70K. As a result, LTC encountered a gut-wrenching sell-off in the following weeks and dropped to over one month low on 4 December. Since then, a major support line of around $141 has prevented bears from running amuck. The region even invalidated a descending triangle setup, which began to form during the second week of December.
However, bulls have had little to write home about. The 38.2% Fibonacci level, outlined via LTC’s drop from $208 to $141, has barricaded LTC’s recovery on a couple of occasions – each leading to a sharp decline soon after.
Moving forward, LTC would now have to close above its 200-SMA (green) and 23.6% Fibonacci level to initiate any upwards momentum. From there, bulls would maintain good volumes to successfully challenge a stubborn resistance at $167. Such a move would help flush out a large degree of selling pressure from the market.
Meanwhile, a close below $141 at any given point could quickly transpire into a major sell-off. The lack of immediate support levels below $141 would trigger a decline between 17%-26% and pressure LTC at its late-July lows.
Indicators
The 4-hour EMA Ribbons identified that LTC has remained bearish for nearly two months now. The price is considered to be weak if it trades below this band of near-mid term EMA’s. Although LTC has closed above these Ribbons on a few occasions, sellers have responded immediately to the move.
The On Balance Volume’s trajectory was even more concerning. The index has constantly declined since November as sell volume outpaced buy volume. Price rallies are rare in such a situation. However, it also may open up a potential reversal, and surging prices could exhaust selling pressure.
Conclusion
Bears will continue to have the upper hand until Litecoin closes above the 38.2% Fibonacci level. Investors should even brace for another sell-off if LTC slips below the major support line of $141.