


It is surprising that Litecoin has flown under the radar over the past few months. According to Google Trends, Litecoin’s 90-day search volume is less than Bitcoin, Ethereum, XRP, and even Solana, for a matter of fact. The visual representation is illustrated below.
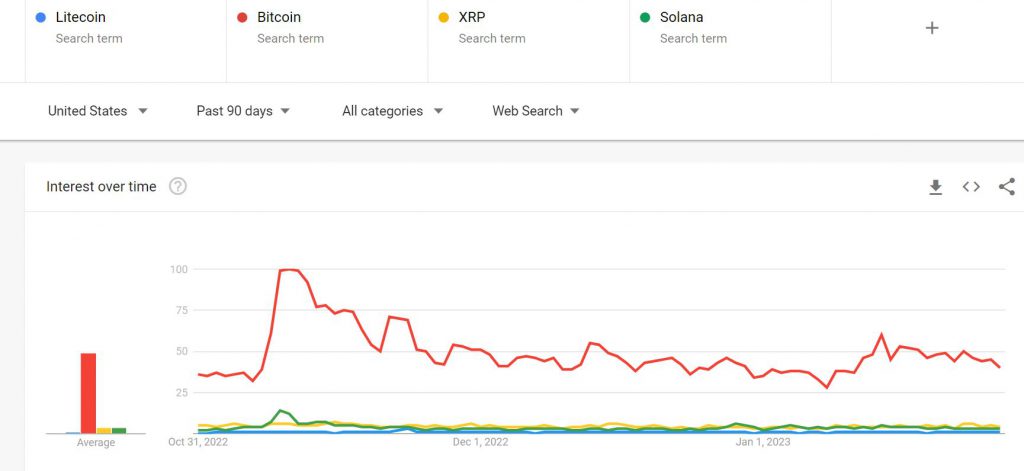
Now, it is ‘surprising’ because, amongst all of those assets, Litecoin is the best-performing one at the moment. If each token’s last bottom is counted, LTC is up by 130%; it’s up over BTC’s 48%, ETH’s 78%, and XRP’s 39% rise. Solana’s case is invalid since it jumped from $10 to $23 this month after the FTX fiasco.
Yet, going back to the trend chart, the importance of interest cannot be taken for granted. Litecoin is still possibly going to follow Bitcoin’s rally. However, betting against the ‘silver BTC’ might not be the best strategy just yet.
Litecoin 4-hour and 1-day chart
In this analysis, we will be drawing reference to a couple of time frames to understand Litecoin’s current market structure. As observed below, Litecoin does not have immediate resistance in its current rally. Its recent high of $97.90 can be easily breached during another bullish push.
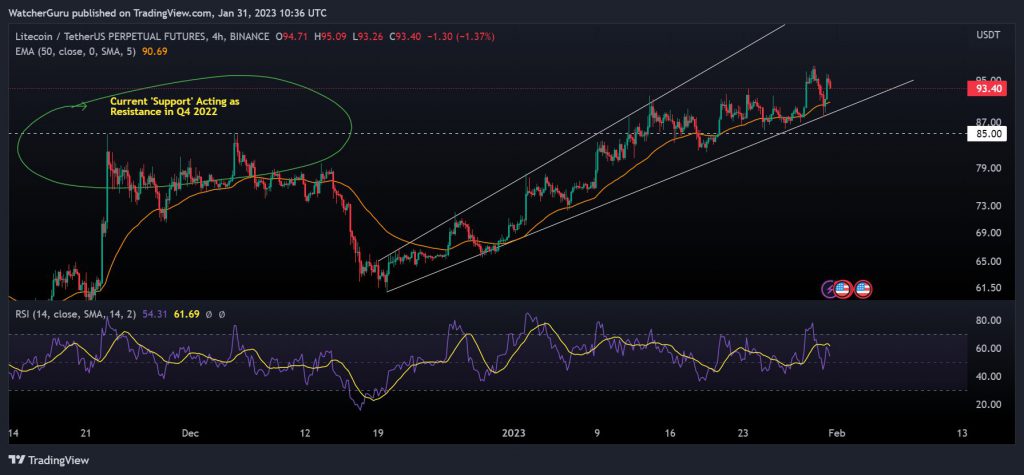
Immediate support is present at $85. The support acted as resistance during LTC’s rally in November-December 2022, which justifies the ‘support’ strength. Now, a bearish pattern is unfolding in the form of ascending broadening wedge. But the asset has continued to bounce from the inclining trend line.
The token remains above the 50-Moving Average, which confirms a continued uptrend trend for the altcoin in the short term. Relative Strength Index is feeling more bearish pressure than usual. However, LTC’s recovery over the past 24 hours is much stronger than other major tokens, as it remains closer to its yearly high.
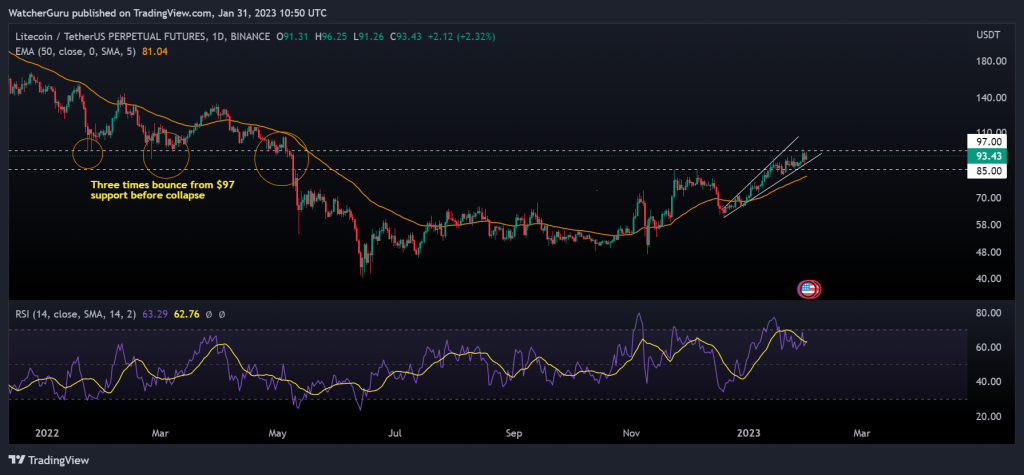
The long-term chart gets more interesting for Litecoin. While the support at $85 remains valid, the resistance at $97 gains more importance in the larger time frame. As highlighted above, $97 was a strong support for LTC in Q2 2022. It bounced above the range three times before eventually dropping under the range. From the current market’s point of view, this indicates the LTC breaching above $97 can trigger a massive rally for the altcoin.
With the Relative Strength Index bullish, LTC is not appearing bearish at all at press time.
What if Bitcoin continues to drop?
Traders should be keeping a close eye between $97 and $85 right now. If Litecoin loses $85 support, then the probability of further correction increases for the altcoin. However, consolidation between the aforementioned range keeps Litecoin in the driving seat for a bullish rally. Hence, any shorting strategy against LTC right now is possibly a risky option.