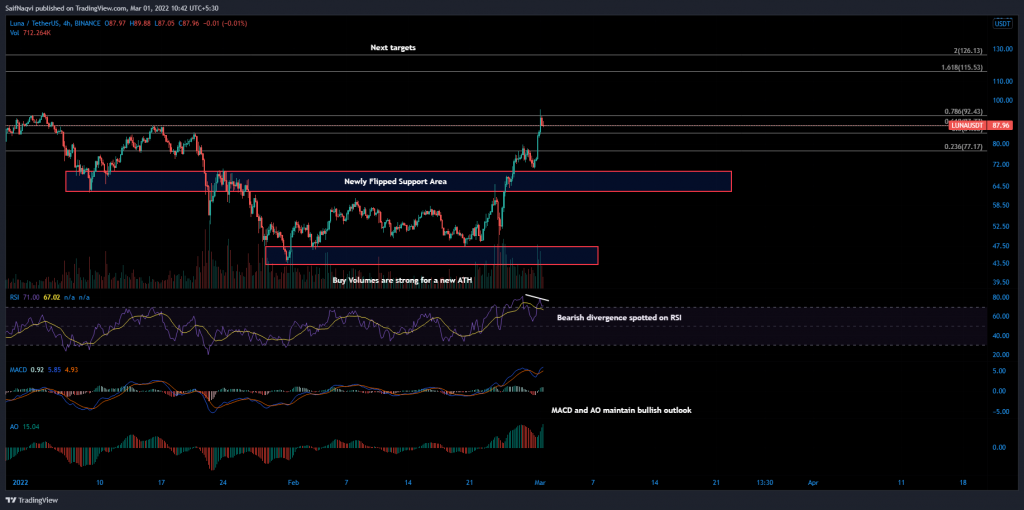
LUNA’s scintillating run has featured since 20 February, with the alt climbing by 100% on the chart in the past in just 9 days. Another 7% increase was needed to tag a previous ATH. However, bearish divergence on the lesser time frame posted some challenges for LUNA heading forward.
Luna 4-hour Time Frame


LUNA’s chart was a showpiece for bullish investors. Three large green candles or ‘three white crows’ emerged at a major support zone and highlighted a strong start to a bullish reversal. The resulting rally overcame slight hiccups at the resistance zone between $63-$71, formed a higher low, and maintained its trajectory above $90.
The trend-based Fibonacci tool was applied to LUNA’s brief correction to $70.6 from $79.7 to highlight potential target areas. The 161.8% and 200% Fibonacci rested at $115 and $126, respectively. These are some important areas traders can target when an earlier ATH is breached.
However, LUNA might stop short of realizing its potential should a few bearish signs strain the alt’s price action. The biggest threat came via two lower peaks on the RSI – bearish divergence. Bearish divergences occur when the price action and indicators are not in conformity. The development, in this case, bearish, is an indication of bulls loosening their grip on the market. Furthermore, the RSI was oversold which in itself can early trigger take-profits.
With only weak near-term supports available at call $87 and $80, a severe correction might drag LUNA’s value back to a newly flipped area of demand between $70 and $63. The daily and 4-hour 50 SMA (yellow) added an extra defensive layer to the demand zone.
On the slip side, LUNA’s Awesome Oscillator and MACD upheld their bullish bias and there was a chance for an extended rally. In such a case, the targets highlighted earlier would come into the picture.
Conclusion
When the indicators present two different arguments, investors can look at the trading volumes to determine the near-term direction of an asset. For the moment, the 24-hour trading volumes were up by 23% and clocked in at over $5 Billion. Such numbers are usually indicative of a rally continuation. However, investors must be cautious of a correction once the volumes start to dwindle.


