


MATIC has taken shape within a rising wedge over the last 10 days and awaits a 20% breakout in either direction. Bulls would hope that MATIC can stretch its value beyond $2.40, while bears would capitalize on any moves below the 50% Fibonacci level. Meanwhile, key indicators present a bullish tone but overbought readings on the Bollinger Bands evened out any optimism.
MATIC 4-hour Time Frame
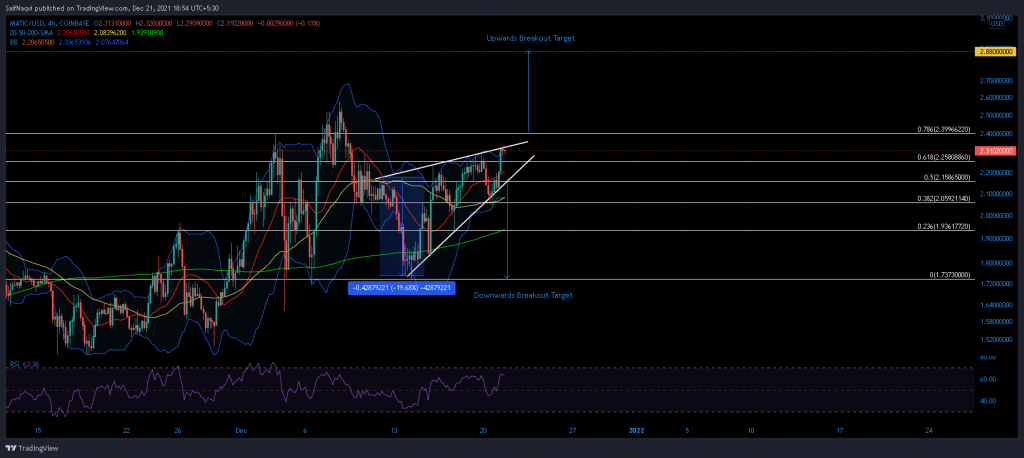
The last week and a half has seen MATIC form three higher highs and three higher lows and take form within a rising wedge. The breakout target is calculated using the highest and lowest point within the pattern, which sits at 20% in this case. Although this pattern is usually considered as a bearish sign, MATIC’s RSI painted a favourable picture. Hence, a breakout in either direction was quite possible.
For a favorable outcome, MATIC would need to extend its value beyond the 78.6% Fibonacci level at $2.40. From there, an additional 20% push would set a new ATH around $2.80 provided bulls can scale past sell pressure at $2.58. Should MATIC fail to break above the upper trendline, a new low can be anticipated at the 50% Fibonacci level ($2.15). If this level is lost, a 20% downwards push would drag MATIC back to its 14 December swing low of $1.73. However, expect buyers to reapply pressure at the 50 (yellow) and 200 (green) SMA’s.
Realistically, MATIC would continue to trade within its wedge if $2.33 functions as resistance while $2.15 provides support. A delayed breakout at the abovementioned targets would then take place over the coming week.
Indicators
MATIC’s indicators were split evenly at press time. The 4-hour RSI traded above 60 and in favorable territory. A reading above 55 is considered as bullish and the same attracts more buying pressure. On the flip side, MATIC’s Bollinger Bands flashed overbought readings and prompted another low at the bottom trendline.
Conclusion
MATIC could continue to trade within its wedge as clear breakout signals develop. Meanwhile, traders must keep a close eye on some crucial levels. A move above $2.40 would give rise to an extended push while a close below $2.16 would pave way for a sell-off.