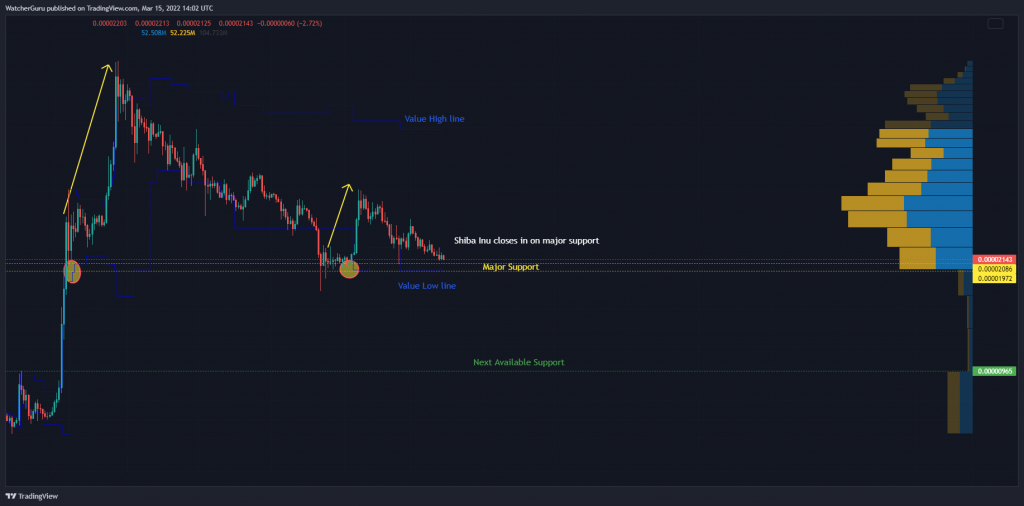
Different investors have different mindsets during market corrections. While some deleverage their positions and swap to USDT, few others lick their lips in anticipation of a market bottom. Early data suggests that traders have begun the buying process on Shiba Inu, with its price zoning in on a ‘potential bottom’.
Shiba Inu Daily Chart


Those who rely on technical analysis for their investments should take note of Shiba Inu’s daily chart. The price was close to a major support line of $0.00002036- an area that has triggered two major rallies since October 2021. Traders usually look out for such areas to place their bets as they carry good chances of another bullish move. Incidentally, the said level also coincided with the Visible Range’s ‘value low’ range.
The Value Area is a range of prices where the majority of trading volume takes place in a specific time frame. A test of the ‘value low’ line signals a good buy opportunity while the ‘value high’ line can lead to selling.
Coinbase Traders On Buy
As SHIB closed in on an important price region, traders were taking bullish calls in the market. A tweet by @ShibAlexander showed that nearly two-thirds of SHIB traders on Coinbase placed buy orders.
A similar reading was observed on 2 February, before which Shiba Inu showed rangebound movement. Over the next few days, SHIB’s value soared by 75% and hit a 1-month high at $0.00003526.
Shiba Inu – Make or break moment?
The abovementioned signs are encouraging but one should also keep a note of how Bitcoin’s movement as well. The king coin was ranging over the last few days and its future trajectory is not clear at the moment.
Should Bitcoin decline below $35K going forward, it would be imperative for Shiba Inu to hold onto $0.00001990- support. The Visible Range Profile showed that Shiba Inu’s next major defensive resource was only available at $0.00000965, indicating an extended correction if SHIB closes below $0.00001990.
At the time of writing, Shiba Inu was trading at $0.00002139, down by 1.5% over the last 24 hours.


