


PEPE price prediction analysis now shows that the popular memecoin has actually reached the Bollinger Band mid-range, and this might be signaling another rally in the near future. After gaining around 20% over the past month, PEPE has entered what looks like a correction phase, dropping about 8.88% just last week. However, several technical indicators are suggesting that this pullback might just be temporary, and the cryptocurrency could be positioning itself right now for another possible upward move.
Also Read: De-Dollarization: Warren Buffett Says the U.S. Dollar Is Going to Hell
Market Volatility, Security Risks, and Key Levels for PEPE’s Recovery

Bollinger Band Pattern Signals Potential Reversal
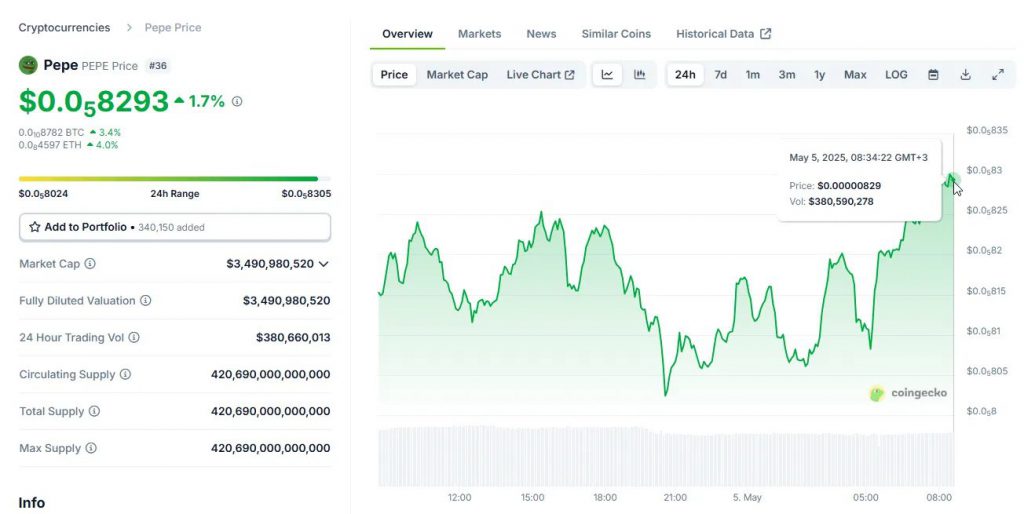
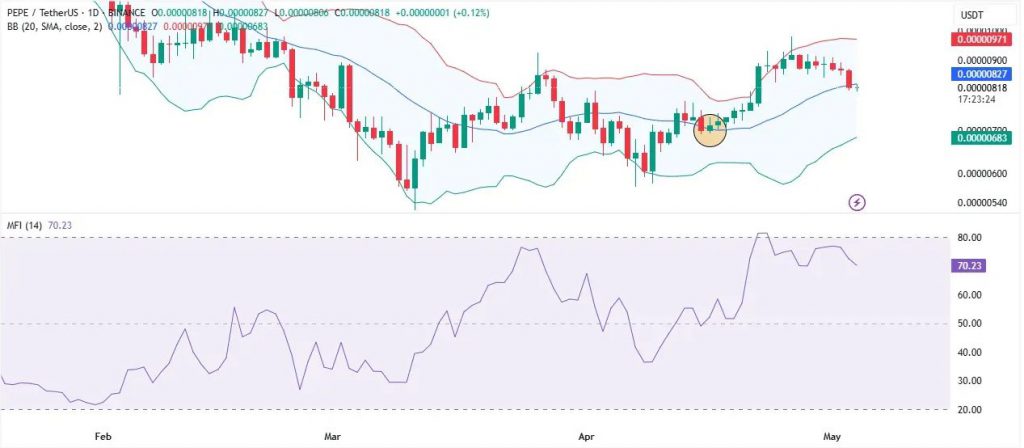
PEPE currently trades at approximately $0.000008293, and recent technical analysis confirms its position at the Bollinger Bands mid-range on the daily chart. Historical patterns seem to favor a somewhat bullish outlook for this PEPE price prediction, as the last time the token actually traded in this particular zone, prices subsequently moved upward and rallied.
The Money Flow Index reading of 72.01 further strengthens the bullish case for this PEPE price prediction. This value, sitting well above the neutral 50 threshold, clearly indicates that strong liquidity continues flowing into the memecoin at the time of writing, which provides decent support for a potential uptrend in the coming days.
Critical Resistance Levels Ahead
Despite these positive technical signals, PEPE also faces some significant overhead resistance that could potentially impede a 20% rally from happening. Current analysis identifies a supply zone that sits right above current prices, and this might trigger increased selling pressure if and when it gets reached.
Also Read: Ripple XRP: ETF Inflows Will Surpass $8B by 2026
If the momentum somehow falters or weakens, there are three key support levels that could provide important bouncing zones for PEPE: $0.00000734, $0.00000645, and also $0.00000578. These levels will be absolutely critical for any PEPE price prediction scenario in case of unexpected downward movement.
Divergent Market Sentiment Creates Uncertainty
Market sentiment around PEPE remains quite divided between futures and spot markets right now. Futures traders are displaying some bullishness with the Open Interest Weighted Funding Rate rising to 0.0121% over just the past 24 hours, which suggests that most open contracts are long positions expecting price increases in the near term.
Also Read: BRICS Nation to Launch a Stablecoin: Why It Will Threaten the US Dollar
The recent period of crypto market activity has revealed that spot traders have transformed from buyers to sellers because they have moved about $2.65 million worth of PEPE tokens to the market. Various price prediction forecasts become challenging due to this recent buying/selling mismatch among PEPE market participants.
PEPE needs to break through existing barriers before it can achieve a 20% market gain while sustaining enough momentum through the observed supply areas. The combination of Bollinger Band mid-range technical positioning and recent strong liquidity inflows with market volatility and security concerns still present forms a minimum basis for possible price growth in PEPE according to this short-term prediction.