


Polkadot is primed for a brief-bull run this week following a bullish divergence and a buy signal on the MACD. Once the targets are met, sellers would likely tighten their noose around the market and drag DOT’s price back to a daily demand zone. At the time of writing, DOT traded at $17.6, down by 6% over the last 24 hours.
Polkadot Daily Chart
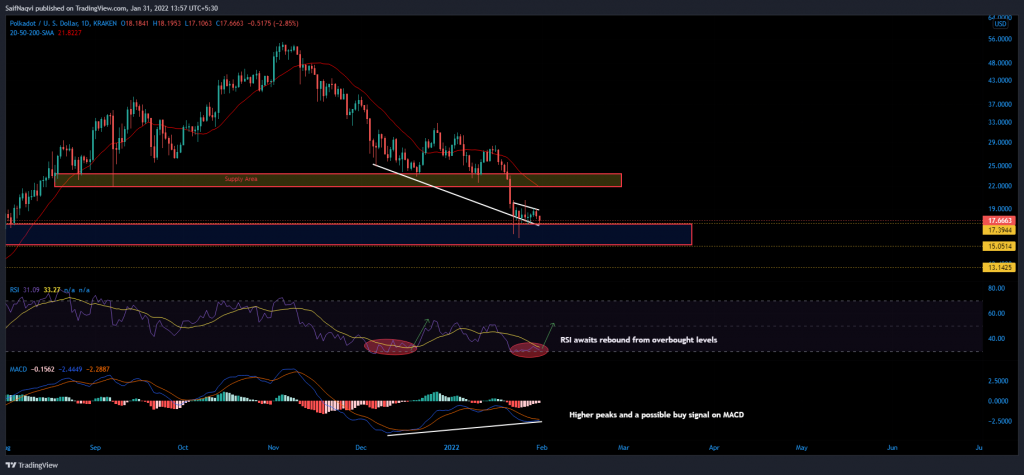
Polkadot was expected to neutralize its dull start on Monday by logging a brief rally between $22-$20 before the weekends. The optimistic outlook was backed by a massive bullish divergence on the MACD and the presence of a demand region between $17.5-$15. The resulting upswing was unlikely to advance beyond the daily 20-SMA (red) and 7 September’s swing low of $21.8. This short-term moving average functioned as resistance and coincided with the lower boundary of a supply zone between $21.5-$23.8.
However, DOT’s price had to hold above $15 to make the most of out a bad situation. An inconvenient breakdown could extend as low as $10.4 if buyers fail to respond between $13.1-12.6 support.
Indicators
DOT’s daily RSI prompted a rebound after languishing at oversold territory since 22 January. A similar outcome was observed on 20 December after the RSI gained assistance below 35 and shot north. However, its movement would likely be capped between 50-55 owing to a larger downtrend.
The MACD called for a stronger buy reaction after forming two higher peaks as opposed to DOT’s price action. The emerging bullish divergence was even backed by a buy signal as the Fast-moving line (blue) eyed a move above the Signal line (blue).
Conclusion
Polkadot was due for a short-term rally if the current selling pressure fizzles out before forcing a close below $15. Several green signals were present on the RSI and MACD to support a bullish effort back between $20-$22.